Volatility and the Greeks
The last time the markets moved with this much pace was the 2008-2009 Financial Crisis, which occurred not long after the introduction of the first iPhone.
That means many investors and traders active in the current environment have never before observed, or dealt with, such dynamic markets.
In some ways, less-experienced traders possess advantages in crisis markets because they don’t have scar tissue from previous trading experiences that can cause hesitation when new opportunities present themselves. As the old saying goes, “fortune favors the bold.”
On the other hand, veteran traders also possess an advantage in dynamic markets because they are familiar with the look and feel of such conditions, which can help them remain calm and maintain a clear head when pressure is mounting.
Familiarity with the behavior of different trading products in different market environments can also represent a distinct advantage.
For traders who are looking to better understand how these options securities behave in fast-moving market conditions, a previous episode of Best Practices on the tastytrade financial network should be of interest.
The content of this particular show is focused on the option “Greeks” and particularly how the speed of the Greeks can change in different volatility environments, as well as when options near their expiration.
As a reminder, the “Greeks,” as they are collectively known, are five parameters which include Beta, Delta, Gamma, Theta, and Vega. Each Greek describes a different dimension of risk in an options position. The Greeks are typically used to help traders more efficiently risk-manage positions, as well as an overall portfolio.
Delta is arguably the best-known Greek because it reports on the sensitivity of an option’s value to changes in the associated underlying stock. This is critical because ultimately all market participants want to understand why they are making or losing money in an options position.
Along those lines, the delta of an option tells us how much the value of our option will change for every $1 move in the underlying security.
For example, if a call option has a delta of 0.50 and the underlying increases from $50 to $51 per share, then the value of that option theoretically increases by $0.50. That might be good or bad for our position, depending on if we are long or short the option.
Because the delta of an option can change so quickly, it’s important to understand how and why this occurs. This phenomenon is due to one of the other Greeks, the parameter known as “gamma.”
Gamma reports by how much the delta of a given option will theoretically increase or decrease for each dollar move in the underlying. That means when gamma is a large number, the delta has greater potential to make big swings. The value for gamma also ranges between 0 and 1.
Looking at another example, imagine that a given long call option worth $1.00 has a delta of 0.40 and a gamma of 0.10. If the price of the underlying stock increases by a dollar, it’s understood that the value of this call option will theoretically increase by $0.40, giving the option a new value of $1.40.
As stated previously, gamma reports by how much the delta of the option will change for a $1 move in the underlying. In this example, that means that the gamma (0.10) must be added to the old delta (0.40) to get the new delta of the option (0.10 + 0.40 = 0.50).
The next step is to look at how delta and gamma change in different trading environments, particularly low volatility vs. high volatility.
On a seperate installment of Best Practices (same series, different episode), the hosts present several helpful visuals to demonstrate the varying behavior of both delta and gamma across different levels of implied volatility. These graphics are shown below:
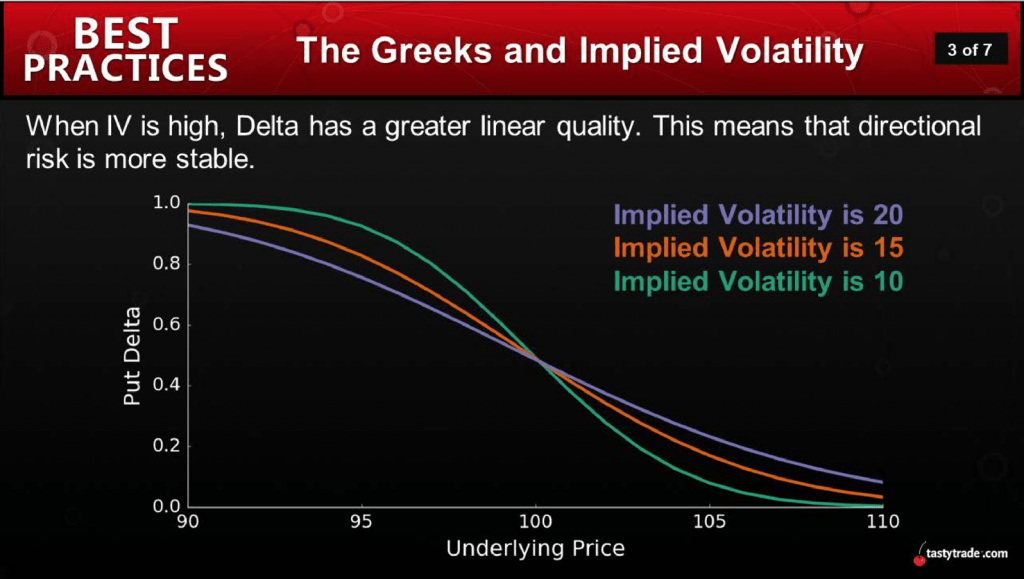
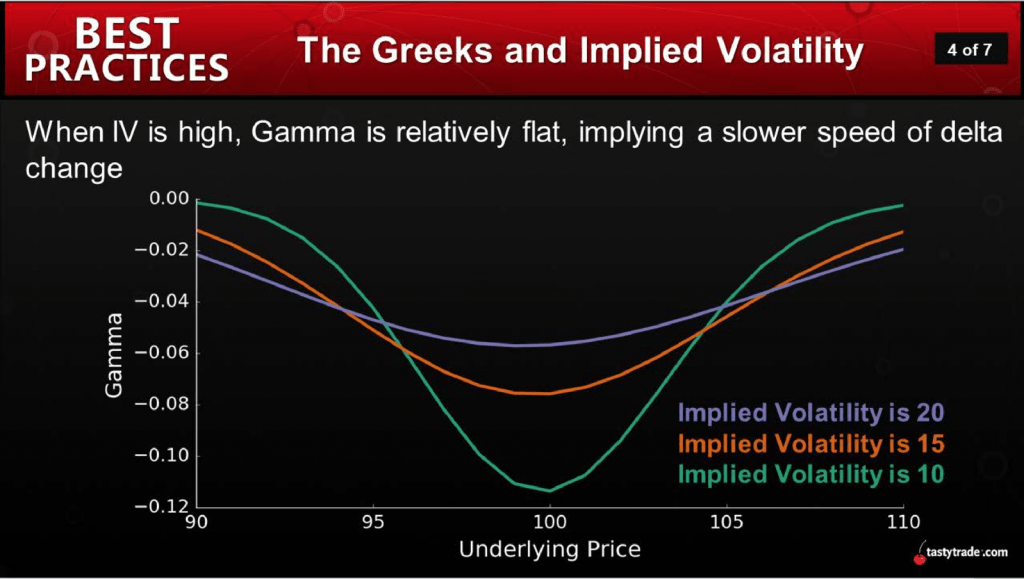
As shown above, when implied volatility increases, it appears that delta and gamma do exhibit different behavior. The first slide reveals that delta gets more linear, which indicates that directional risk is more stable. The second slide reveals that gamma is flatter, which provides further background on why delta is less variable.
It should be noted that gamma can also be particularly tricky as expiration gets closer.
The example below highlights how a position’s sensitivity to movement transforms as a position gets closer to expiration. The snapshot below shows two identical positions with one small exception: The position on the left has 30 days until expiration, while the position on the right has only one day until expiration.
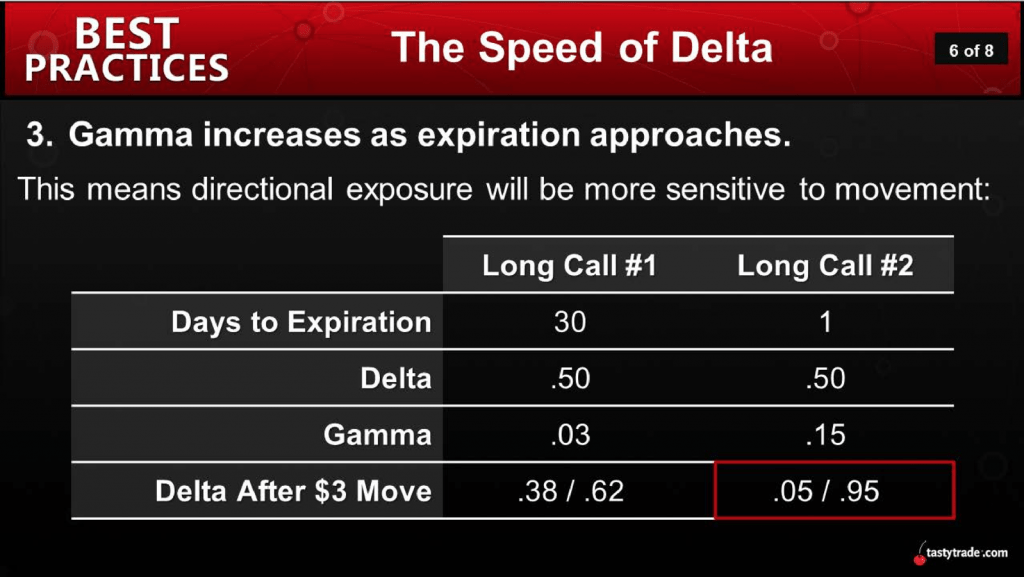
As one can see, the position is the same, but the risk profile has changed dramatically with expiration looming. This is attributable to the changing nature of gamma over the lifetime of a position.
In general, gamma will be highest for options with strike prices that are closest to the current market price of the underlying security (e.g. at-the-money options, ATM), and relatively lower for in-the-money (ITM) and out-of-the-money (OTM) options.
As expirations gets closer, this relationship gets even more pronounced, as illustrated below:
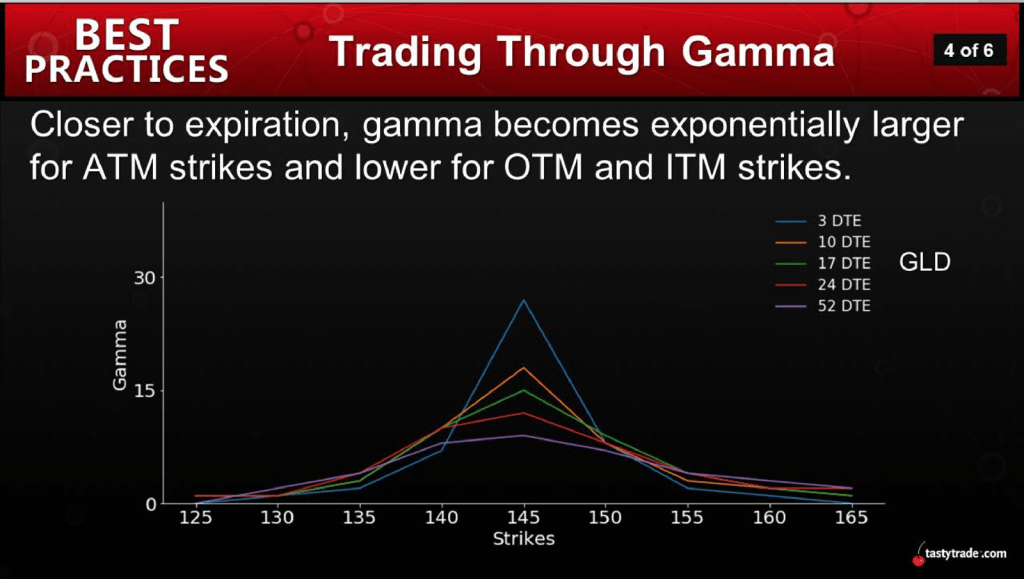
The above helps illustrate why many traders tend to exit positions well ahead of expiration week, therefore avoiding the uncertainty often linked with rising gamma.
In volatile markets that are susceptible to big unexpected moves, it’s arguable that gamma risk heading into expiration week is even higher. Consequently, it may be appropriate to execute even stronger risk-management protocols during these periods.
To learn about the Greeks and how they behave in different types of trading conditions, readers can review the following shows on the tastytrade network when scheduling allows:
Sage Anderson is a pseudonym. The contributor has an extensive background in trading equity derivatives and managing volatility-based portfolios as a former prop trading firm employee. The contributor is not an employee of Luckbox, tastytrade or any affiliated companies. Readers can direct questions about topics covered in this blog post, or any other trading-related subject, to support@luckboxmagazine.com.