Volatility: Best Friend or Worst Enemy?
The VIX quantifies risk and fear: Check it to take the pulse of the market
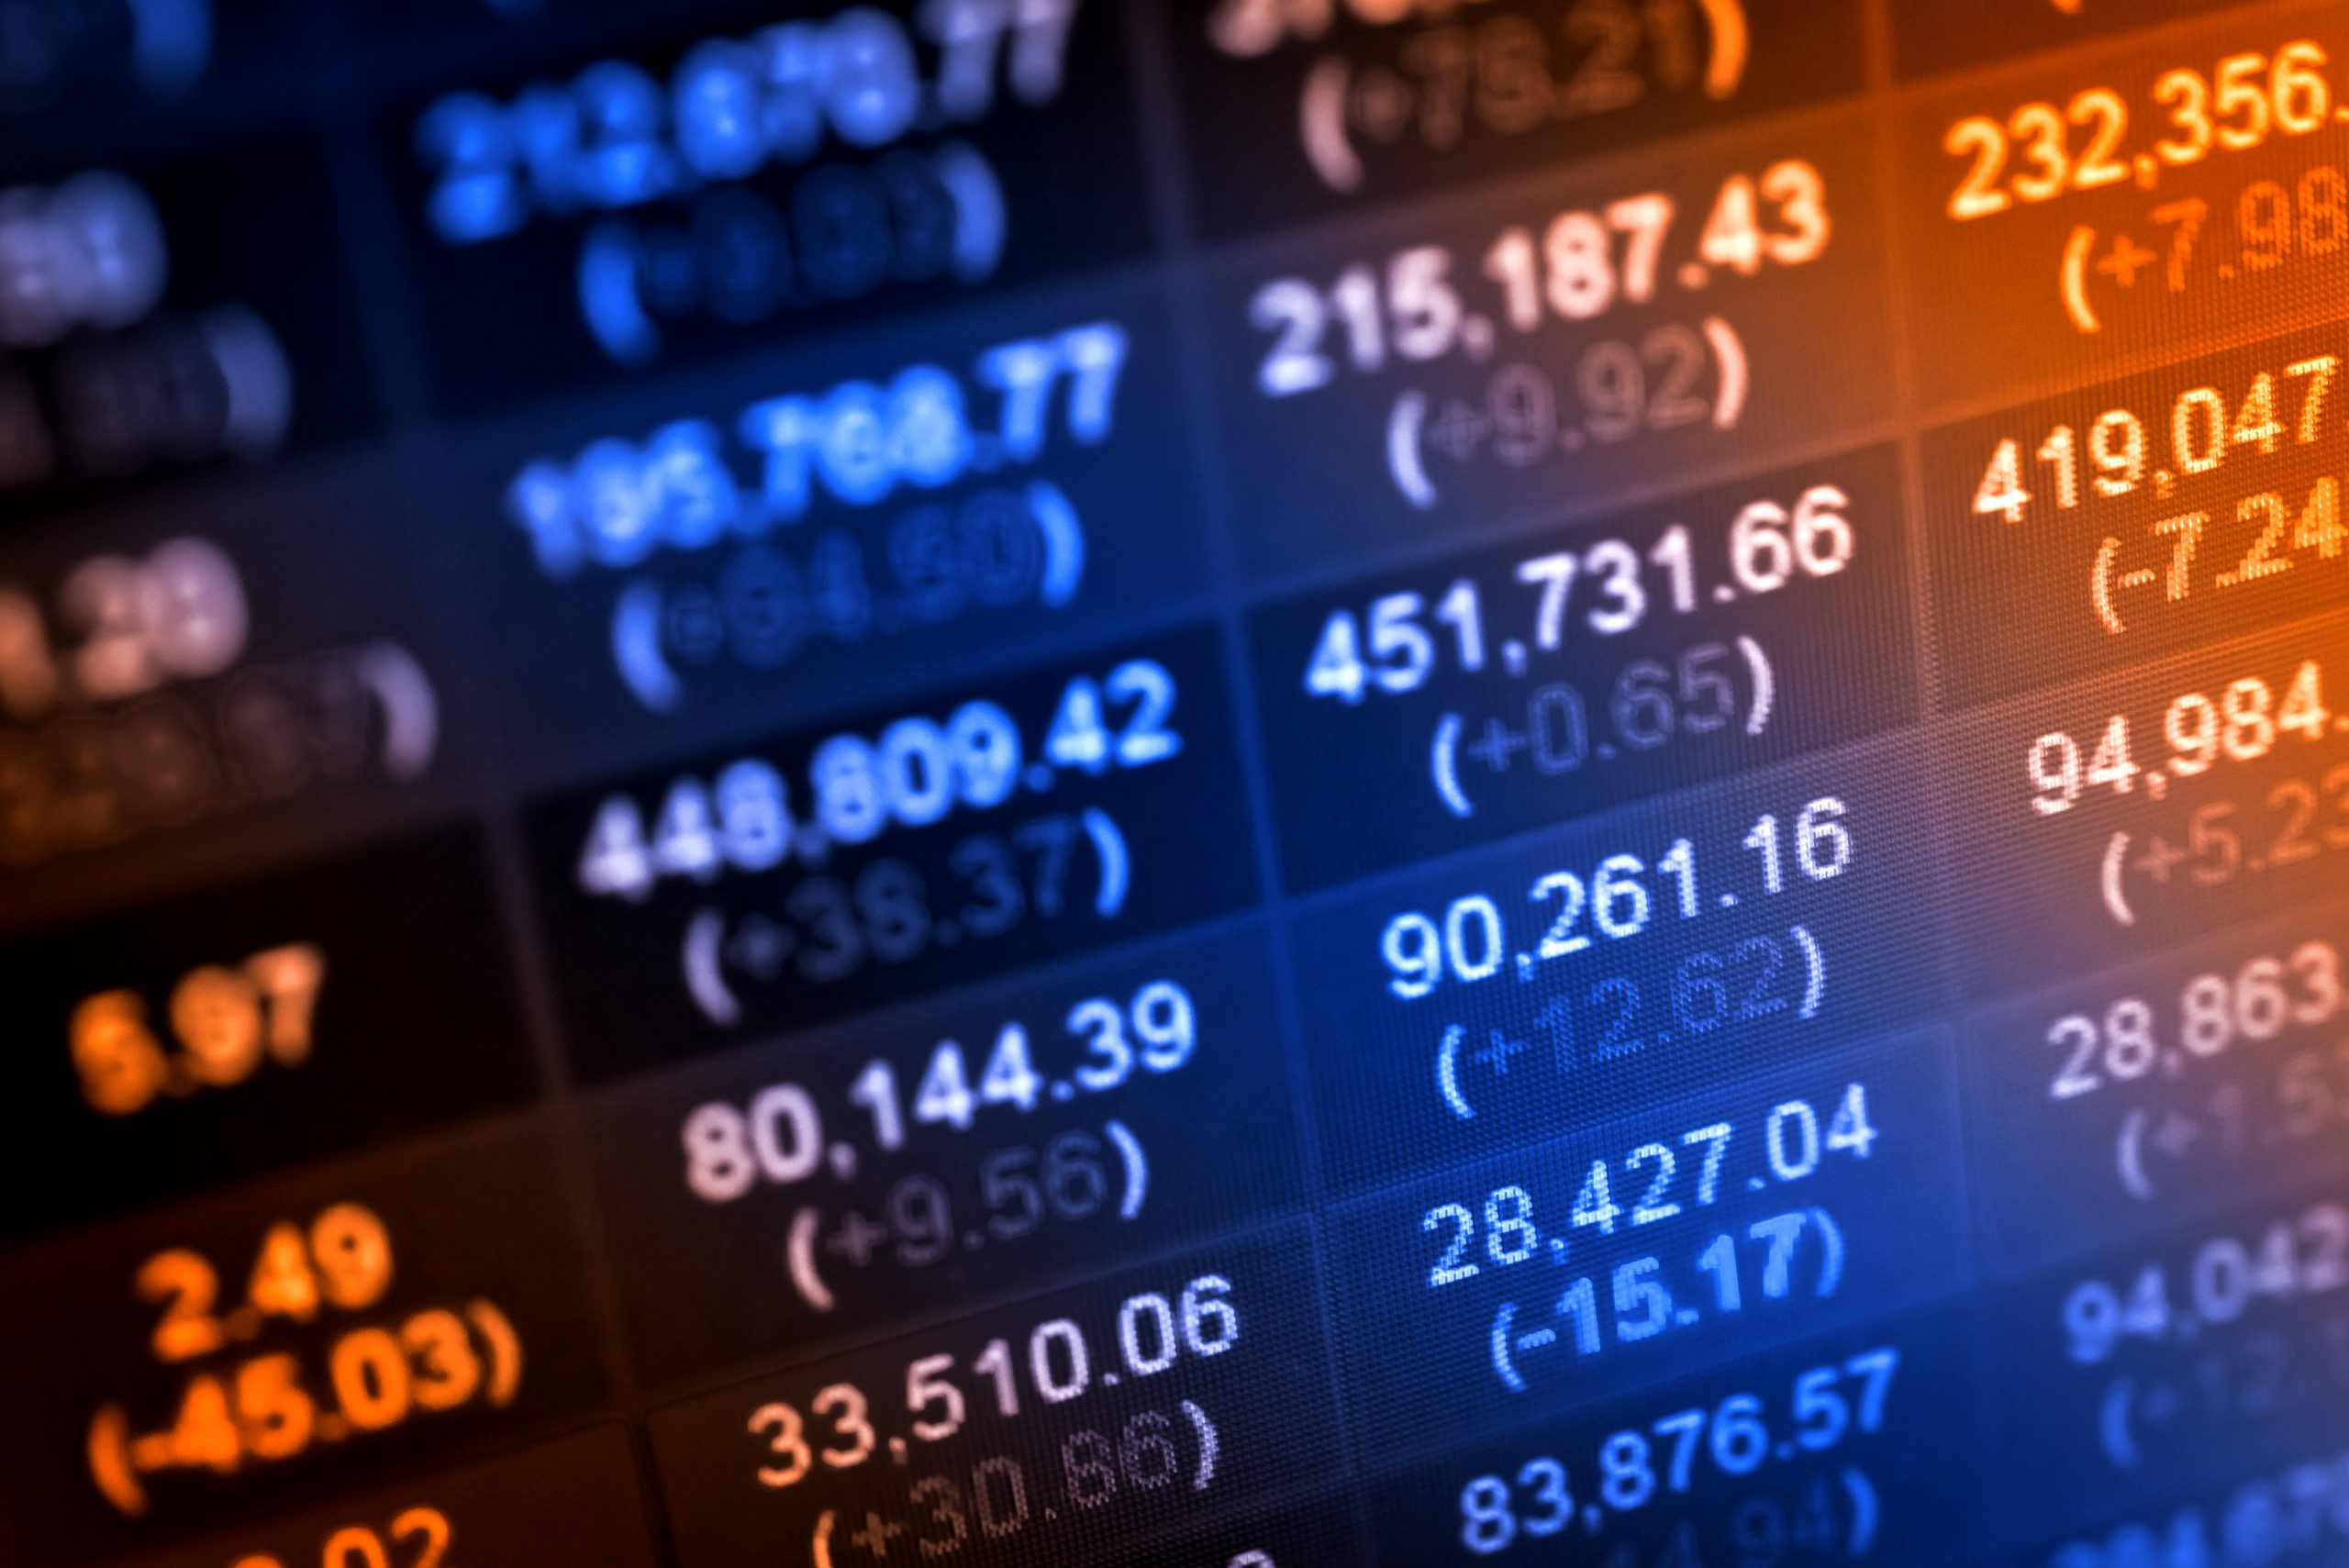
The VIX measures implied volatility, making it one of the most important metrics in options trading. It’s determined by the current price of options traded in the market. When volatility climbs higher, option prices are high. When volatility dips lower, options prices also go low.
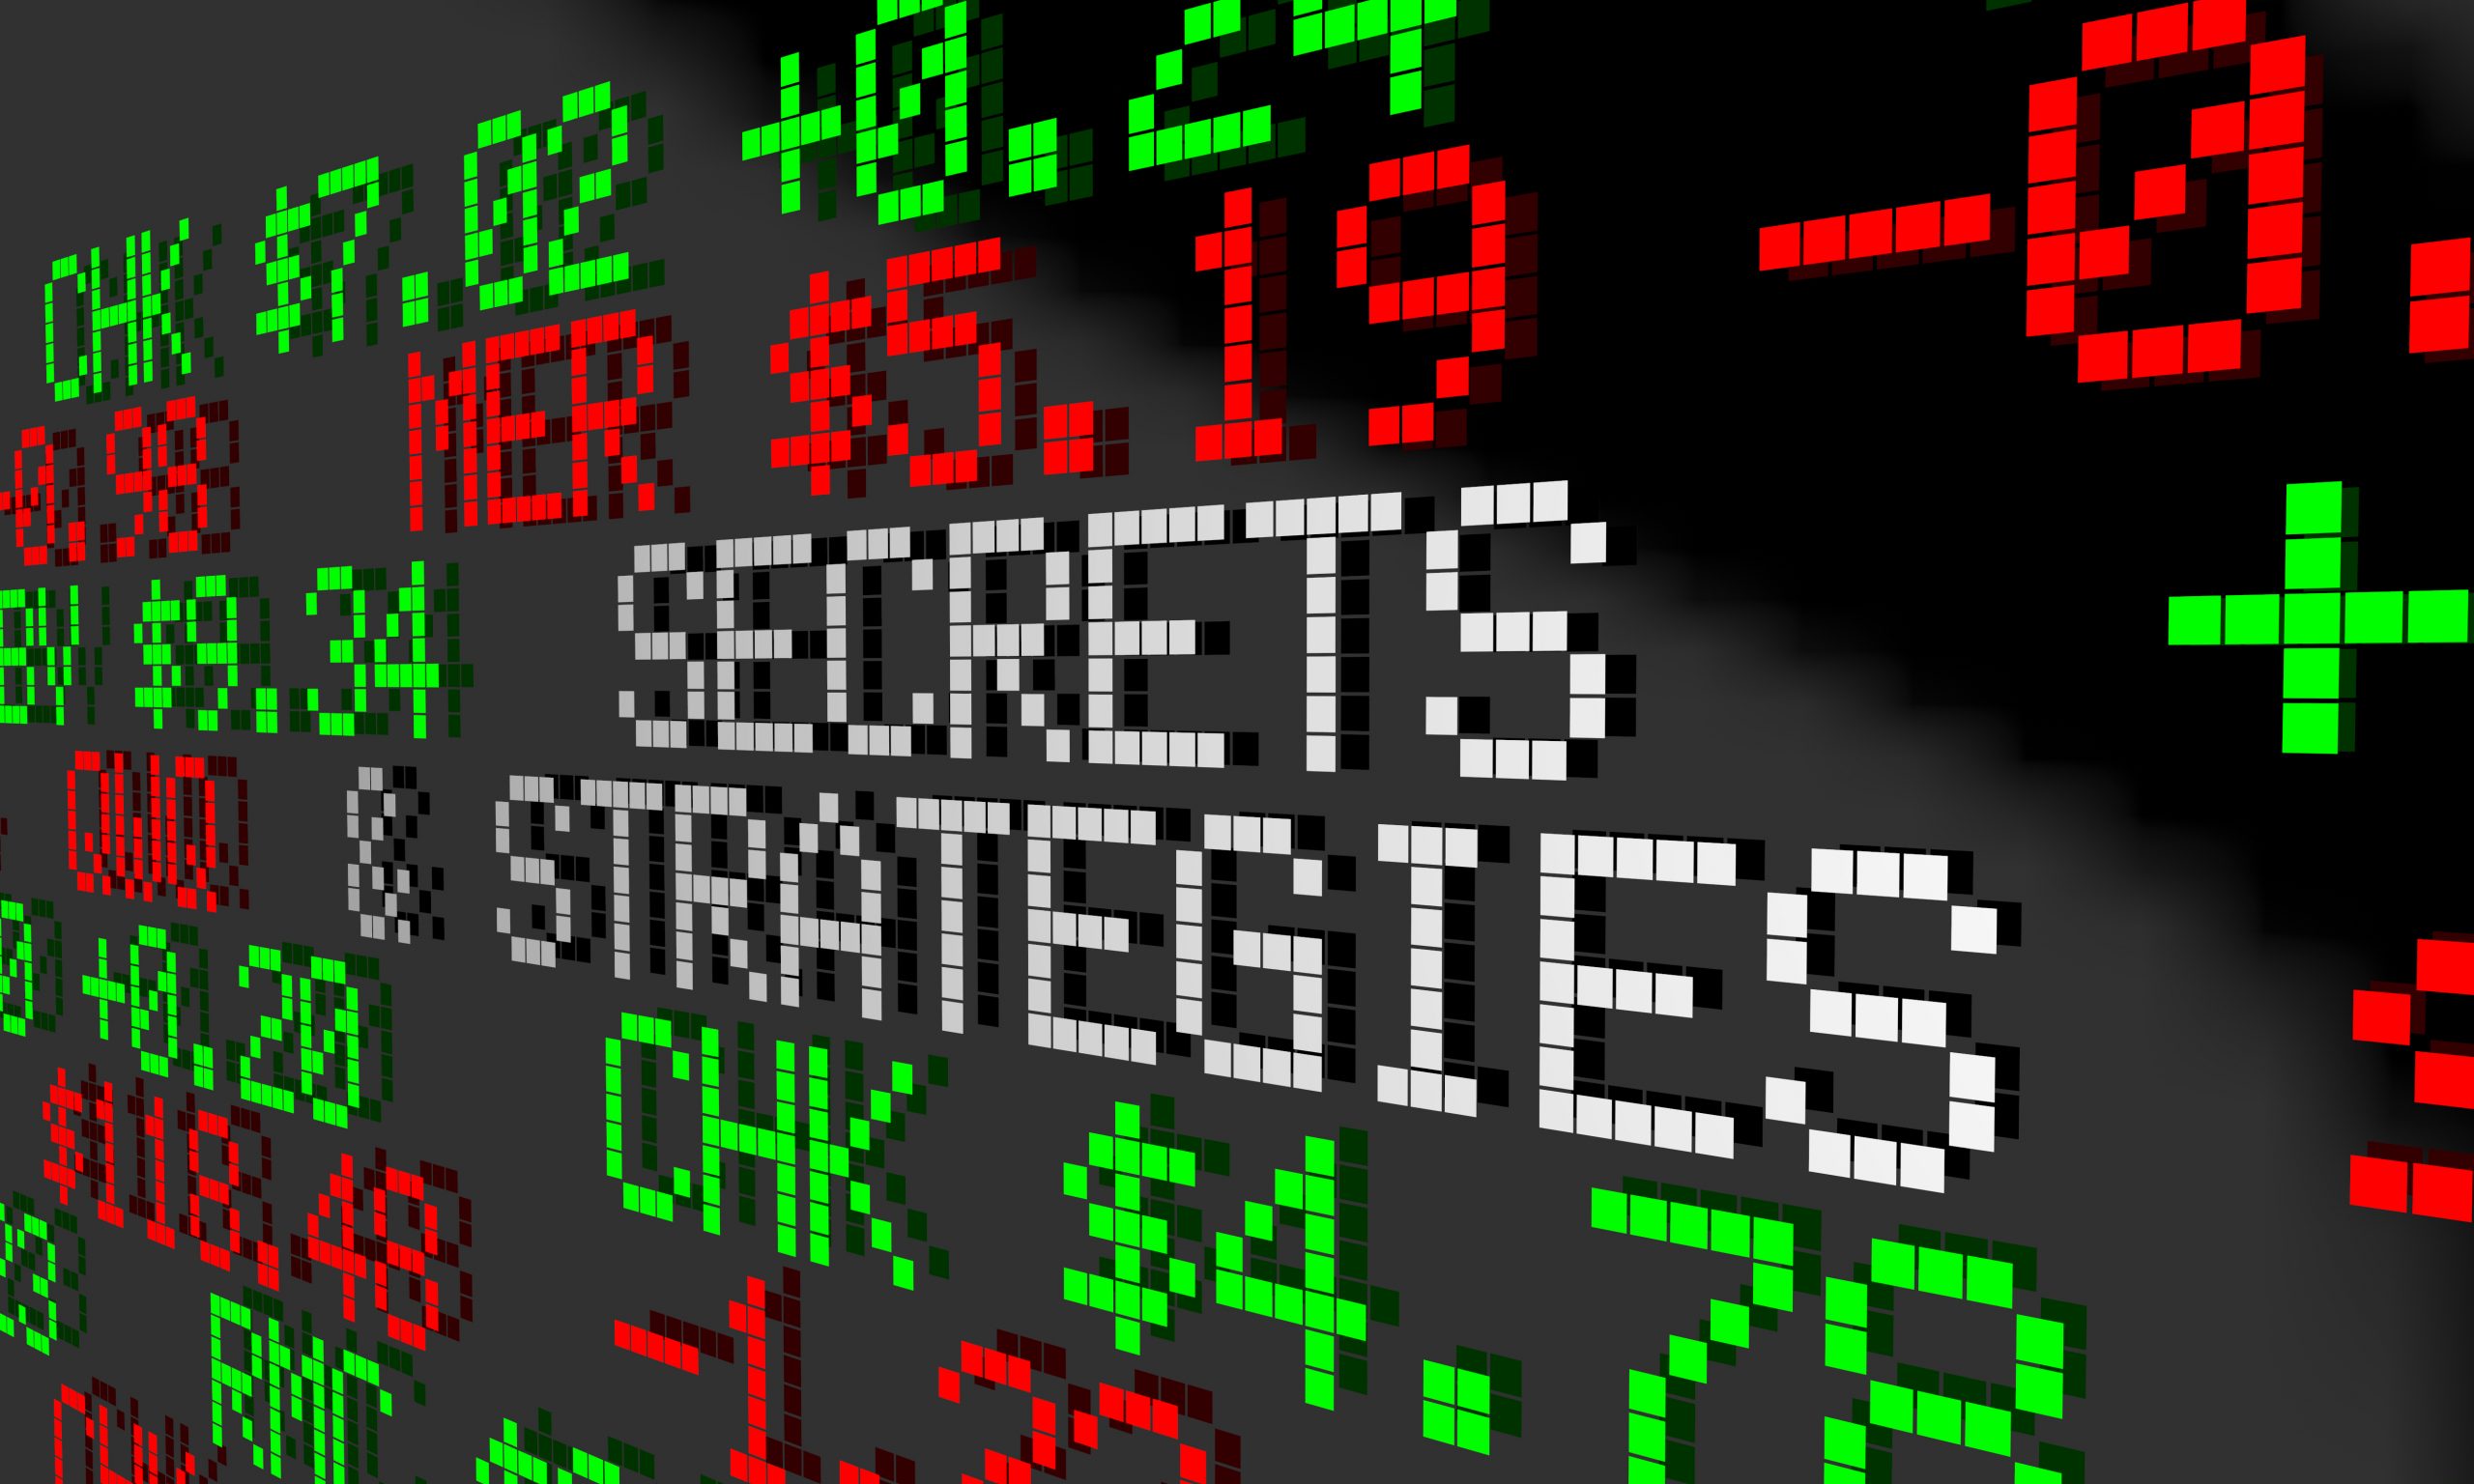
Many strategies relate to the level of VIX but, most important, it tells traders how they might expect to see the market move over time. When VIX goes high, the market is predicting a lot of movement. But when it’s low, it means just the opposite.
Volatility expands when the market changes. Typically, this move is a move in price. When the price of the market goes down, the volatility goes up. When the price goes higher, traders see a decrease in volatility.
Some attribute a particular nugget of wisdom to an anonymous trader, who once supposedly said: “When the market is going up, no one is afraid because everyone is making money. When it goes down, though, everyone gets scared.”
Think of VIX as a quantified measurement of risk and fear. That means traders can check the heartbeat of the market by observing where it is currently trading. They can tell if it’s a period of fear or relative calm. Knowing that, they can adjust their risk to match market conditions or trade the fear itself.
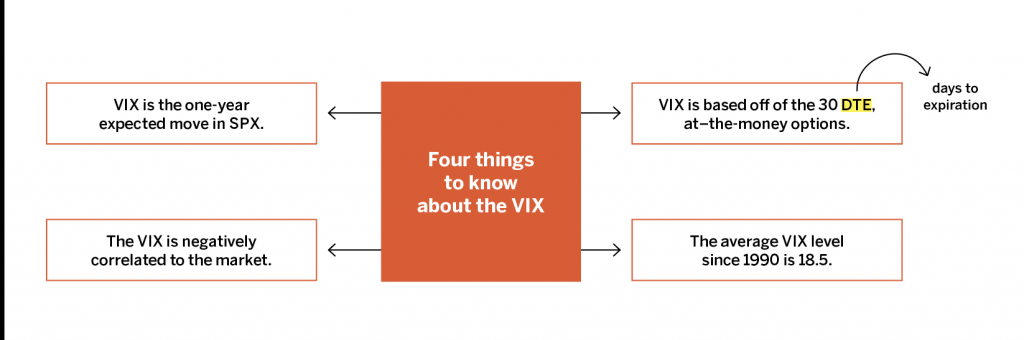
Volatility can feel like a best friend or worst enemy. This flowchart should help get the message out about this most important metric. Memorize the chart to be a step ahead of most traders.
Mike Hart is a former floor trader at the Chicago Stock Exchange and a proprietary futures trader, specializes in energy markets and interest rates. He’s a member of the tastytrade research team.
Anton Kulikov is a trader, data scientist and research analyst at tastytrade.