Bear Market Models
Beware the unholy combination of global pandemic, sharply reduced GDP, unprecedentedly high unemployment and a bear market correction
Reactions to the COVID-19 global pandemic, including the lockdowns, quarantines and social distancing, have shut down enough businesses and industries to crack the foundation of humanity’s financial security.
The quickly spreading fissures are difficult to track, but at this writing the virus has eliminated the jobs of more than 36 million Americans. Worldwide, 11.9% of the workforce has been idled, according to a 20-nation study by the Brookings Institute.
Meanwhile, productivity has taken a hit. In the United States, for example, gross domestic product declined by 4.8% during the first quarter, the first such pullback since 2014.
That’s enough economic turbulence to make financial markets jittery. It’s been reflected in an extreme bout of market volatility that pushed the VIX (the Chicago Board Options Exchange Volatility Index) to a new all-time high in mid-March 2020. Yes, it was even higher than during the 2008-2009 Financial Crisis.
Because the S&P 500 had fallen 34% at its lowest point of the year (March 23), U.S. stock markets were proclaimed to be in “bear market” territory, which is defined as a pullback of 20% or more.
To put that into context, bear markets have occurred in the U.S. an estimated 11 times between the 1926 and 2017 bear markets. They’ve lasted from three months to 37 months and have ranged in magnitude from a 21% decline to an 86% decline—the latter during the Great Depression of 1929-1932.
“Historic performances,” (below), highlights nine of the most recent bear markets and ensuing bull markets.
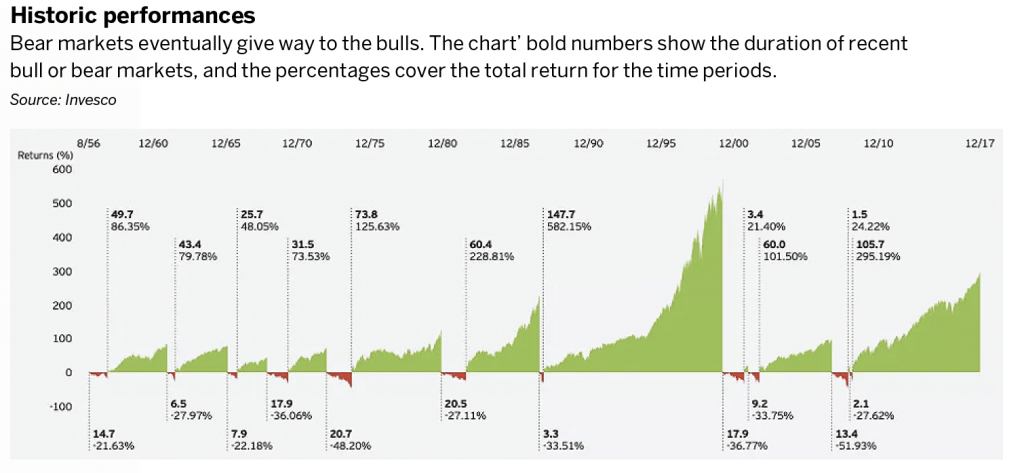
Of the nine bear markets, only one didn’t coincide with a severe economic contraction in the United States. The one bear market that didn’t parallel a recession was the infamous crash of 1987 (a pullback of 33%).
That bear market was also the shortest of the nine included in the graphic, lasting 3.3 months.
While history provides no guarantee of future performance, this data indicates that historical bear markets which have been accompanied by economic recessions have, on average, lasted longer than bear markets which have not been accompanied by severe economic impairment.
That also means that since the crash of 1987, every bear market in the United States has been accompanied by an economic recession.
Another notable data point in “Historic performances” indicates that U.S. equity markets entered a bear market in the summer of 1957—about the time the Asian Flu landed in America. The chart in “Teddy bear markets,” (below), zooms in and magnifies the performance of the S&P 500 during this period.
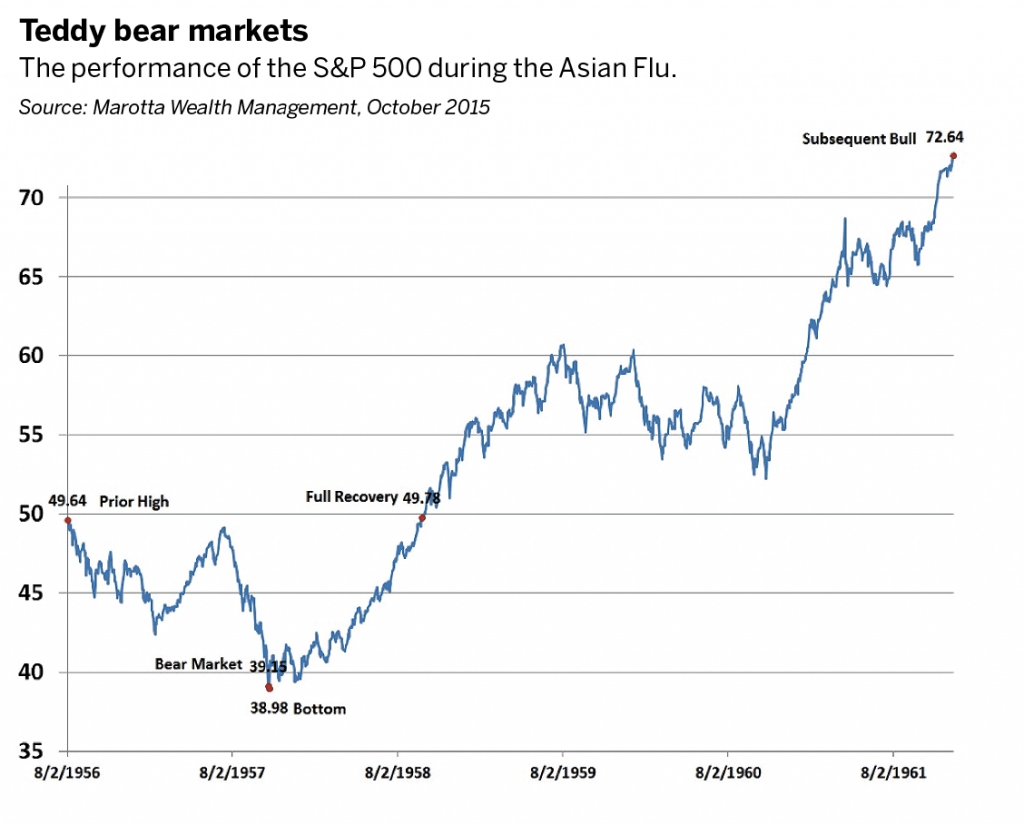
The bear market correction shown in Teddy bear markets has been called the “Teddy Bear Correction of 1957” because it was relatively mild. The correction saw the S&P 500 hit its low on Oct. 22, 1957, down roughly 21% from recent highs.
But the Asian Flu not only catalyzed a bear market correction in U.S. markets, it also caused an American economic recession lasting eight months.
Once again, eight of the nine bear markets that have occurred in the United States since the 1950s have been accompanied by a recession. And two of those eight have taken place in the 21st century—the “Dot-com Bubble” correction from 2000-2002 and the “Financial Crisis” correction from 2008-2009.
Based on current data and models, it appears that today’s “Coronavirus Crisis” will follow suit and become
No. 3—meaning this period in history will also be characterized by both a bear market correction and a recession.
At its lowest point this year, the S&P 500 slid to 34% off recent highs—well past the 20% defined as a bear market.
U.S. GDP appears likely to decline by as much as 30% in the second quarter, the most precipitous fall in history.
Likewise, economic data for the United States leaves little doubt the country may already be in recession.
The Bureau of Economic Analysis announced at the end of April that U.S. gross domestic product (GDP) had declined by 4.8% in the first quarter of the year. That was the first quarter-over-quarter decline since the first quarter of 2014, when GDP shrank by 1.1%.
Recession is defined as two consecutive quarters with a decline in GDP. A depression is regarded as more pronounced and longer-lasting than a recession.
Models indicated U.S. GDP would decline by as much as 20% to 30% in the second quarter. That would not only indicate a recession (Q1 and Q2 2020), but also the largest single-quarter decline in economic activity in U.S. history.
Before the current crisis, the largest modern decline in American GDP was recorded during the late 1950s’ recession, which saw first-quarter GDP in 1958 decline by 10%. That occurred during the “second wave” of the 1956-1958 Asian Flu outbreak.
The precipitous decrease also underscores how the Asian Flu of the 1950s was characterized by a deep recession combined with a bear market correction—essentially the same set of circumstances observed during the current coronavirus pandemic.
And this time, the threat from the pandemic is more grave than in 1956-1958 because of the higher mortality rate of COVID-19 versus the Asian Flu.
The question at hand, therefore, centers on the depth and length of the current economic contraction. During the Asian Flu outbreak of 1956-1958, the U.S. economic recession lasted eight months and brought a decline in GDP (peak to trough) of 3.7%.
Bear markets have occurred 11 times between 1926 and 2017. They’ve lasted from three months to 37 months and have ranged in magnitude from a 21% decline to the Great Depression’s 86% plunge.
By comparison, the Great Recession of 2008-2009 saw a decline in GDP (peak to trough) of 5.1% and lasted 18 months, while the Great Depression was accompanied by a decline in GDP (peak to trough) of 26% and lasted 43 months.
If the unemployment rate is any indication, then the coronavirus crisis peak to trough decline in GDP will likely fall somewhere between the Great Recession and the Great Depression.
The peak unemployment rate during the Asian Flu was 7.5% (July 1958). During the Great Recession, unemployment peaked at nearly 10% (October 2009). It’s believed that the unemployment rate swelled as high as 25% amid the Great Depression.
Unemployment in the U.S. as of May 2020 currently stands at about 15%, although it is believed that figure will be revised upward when the June date is released. One would expect it will take months, as opposed to days or weeks, for this number to come down significantly—even in the best-case scenario.
Alternatively, a potential “second wave” of the virus could force another shutdown of the economy in fall/winter. If that comes to pass, it’s plausible that extreme levels of unemployment could persist for many months.
As such, this tumultuous period will eventually be characterized as either a second relatively brief and mild “Teddy Bear” correction or a second version of the long and harsh horror show known as the Great Depression.
The Black Death
Few doubt the ferocity of the COVID-19 outbreak, which had claimed 325,000 lives worldwide at press time. But, thankfully, the current pandemic’s death toll won’t match the devastation wrought by the bubonic plague known as the Black Death.
Peaking for four frightening years, from 1347 to 1351, that earlier pandemic killed between 100 million and 200 million people in Europe and parts of Asia and Africa. That made it the worst plague in history. The tragedy struck when the planet’s estimated population totaled just 500 million.
The recovery? Europe needed two centuries to reach its pre-pandemic population.
The Spanish Flu
The Spanish Flu of 1918-1919, the third-deadliest epidemic in history, infected 500 million people, about a third of the people in the world. It killed 17 million to 50 million, and perhaps as many as 100 million people.
When the pandemic arrived, the earth’s population numbered 1.5 billion, which means—depending upon the mortality estimate—it eliminated perhaps 3% of the human race.
Wartime censors softened reports of the pandemic’s spread in Germany, the United Kingdom and France to maintain military morale as World War I came to a close. Reporters remained free to report the news in neutral Spain, leading to the plague’s name.
The Asian Flu
The Asian Flu of 1956-1958 was first observed in China and thought to combine Avian Flu from geese with human influenza.
In the United States, the first wave of the virus peaked in October 1957, but the deadlier second wave didn’t reach its apex until February and March 1958.
Between one million and two million people died as a direct result of Asian Flu, but some experts believe fatalities totaled as many as four million. It was considered the ninth-deadliest pandemic in history.
Andrew Prochnow, a longtime options trader and columnist, visits Asia quarterly and owns a stake in a technology company in Shenzhen, China. @AndrewProchnow