Trump Trade 2.0: The Energy Sector Would Benefit if Trump Regains the White House
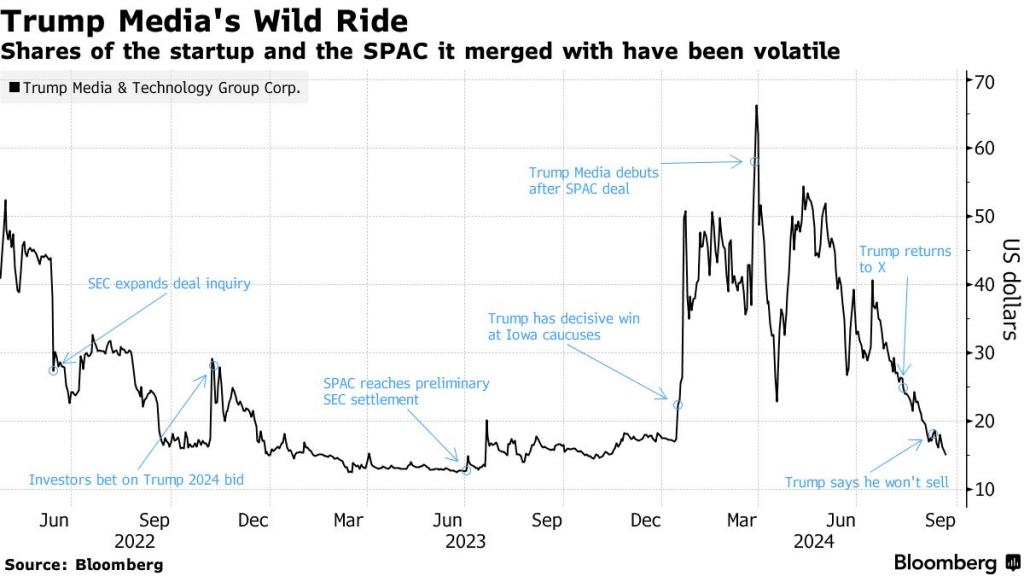
Meanwhile, the ups and downs of Trump Media & Technology Group (DJT) stock provide a campaign barometer

- The “Trump Trade” originated during Donald Trump’s first presidency, driven by pro-business policies that fueled market gains, particularly in energy and financials.
- In 2024, the Trump Trade includes Trump Media & Technology Group, which some consider a proxy for Trump’s political status.
- The energy sector could see significant gains if Trump’s election prospects improve because of his support for fossil fuels and deregulation.
The “Trump Trade” gained prominence during Donald Trump’s presidency, driven by the market’s enthusiastic response to his pro-business agenda. Investors rallied behind sectors expected to benefit from Trump’s policies of lower taxes, deregulation and a tougher stance on trade. Financials, energy and technology stocks surged following his 2016 election victory as markets embraced his business-friendly governance.
A catalyst for the Trump Trade came with the passage of the 2017 Tax Cuts and Jobs Act, which lowered corporate tax rates, boosting profits and shareholder returns. It fueled bullish sentiment in industries poised to thrive with deregulation.
Let’s explore how the Trump Trade changed and what implications it would have for financial markets.

DJT as an election barometer
In 2024, the “Trump Trade” has taken on a new dimension with the emergence of the Trump Media & Technology Group (DJT) as a publicly traded company. It owns the Truth Social, a social media platform that’s become a barometer for Trump’s chances in the upcoming election. As his political fortunes rise or fall, so too does the company’s stock price, intertwining the its financial prospects with the outcome of the race.
If Trump were to win the presidency again, it’s expected that DJT would see a significant boost. A victory could drive an influx of new users to Truth Social, increase advertising revenue and solidify the alignment between Trump’s public persona and his media ventures. That’s why DJT has become closely tied to the market’s perception of Trump’s likelihood of reclaiming the White House.
This connection has been on full display in DJT’s price action throughout 2024. Earlier in the year, when President Joe Biden was still running, DJT reached a 52-week high of nearly $80 per share, as optimism about Trump’s chances peaked.
However, after Biden stepped aside and Vice President Kamala Harris became the Democratic nominee, DJT shares steadily declined, recently hitting a 52-week low of around $12 per share.
Of late, however, shares of DJT have rebounded to around $20/share. And this reversal of fortune mirrors the latest trend in the political betting markets, where Trump has gained ground on Harris.
As the election draws closer, DJT is likely to continue serving as a real-time barometer for Trump’s standing in the race, with political developments directly influencing its stock price. A rebound could signal renewed optimism about Trump’s election prospects, potentially reigniting the broader Trump Trade.
The energy sector, in particular, could benefit if Trump’s chances improve. His staunch support for fossil fuel has been a defining feature of his economic policies, and a resurgence in his prospect political prospects could boost momentum in this sector. Investors may anticipate a rollback of energy regulations under a second Trump presidency, leading to significant gains for oil and gas companies.
Case in point, Trump’s recent rise in the polls has coincided with a rebound in the Energy Select Sector SPDR Fund (XLE). This well-known energy ETF has gained 6% over the last 10 trading days. Before that surge, XLE had been the worst performer among the 11 primary sector ETFs listed below.
Year-to-Date Sector Performance (as of 10/9/24)
- Communication (XLC): +25%
- Utilities (XLU): +23%
- Technology (XL3): +22%
- Financials (XLF): +21%
- Industrials (XLI): +21%
- Consumer Discretionary (XLY): +12%
- Consumer Staples (XLP): +12%
- Basic Materials (XLB): +11%
- Health Care (XLV): +11%
- Energy (XLE): +8%
- Real Estate (XLRE): +7%
Why Wall Street prefers gridlock
Regardless of who wins the election, the real catalyst for the stock market may be the balance of power in Washington. Historically, markets have performed best during periods of gridlock, where one party controls the presidency and the other holds at least one chamber of Congress. This division tends to prevent sweeping legislative changes, fostering the stability and predictability that investors and businesses favor.
Between 1950 and 2017, the S&P 500 delivered its strongest returns under divided governments. For instance, when a Democratic president worked with a Republican-controlled Congress, the S&P 500 saw average annual gains of 18.3%—far above the typical return of 12.3%, according to LPL Financial.
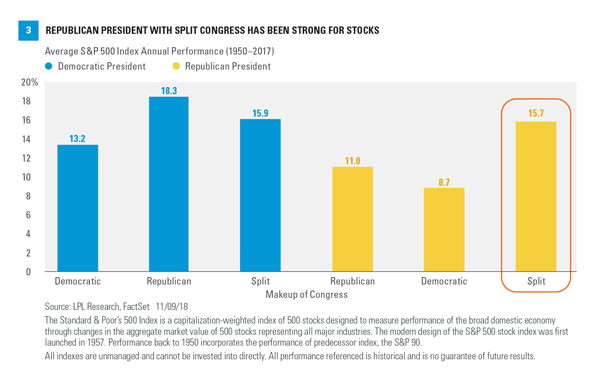
As shown above, a split Congress has also historically produced strong returns under Republican presidents (far right). And as the 2024 election approaches, the likelihood of gridlock appears high.
Vice President Harris is slightly favored to win the presidency, while Republicans are projected to take control of the Senate and Democrats are favored to win a majority in the House. That potential division of power may help explain the stock market’s recent strength, as investors anticipate the stability and predictability that gridlock has historically provided.
For Wall Street, a divided government often signals fewer regulatory surprises and a continuation of the status quo—conditions that tend to keep markets on a steady upward trajectory. Note that the stock market has performed well during the past eight years, encompassing the tenures of Presidents from both parties.
To learn more about the proposed economic policies of both candidates, readers can check out these these Luckbox articles:
- We’re Finding Plenty To Criticize in the Harris and Trump Economic Platforms
- Trump vs. Harris: The Stage is Set for a Corporate Tax Showdown
Andrew Prochnow has more than 15 years of experience trading the global financial markets, including 10 years as a professional options trader. He is a frequent contributor to Luckbox Magazine.
For live daily programming, market news and commentary, visit tastylive or the YouTube channels tastylive (for options traders), and tastyliveTrending for stocks, futures, forex & macro.
Trade with a better broker, open a tastytrade account today. tastylive, Inc. and tastytrade, Inc. are separate but affiliated companies.