Correlations, Volatilities and Meta
If you like X, you might also like A, B and C
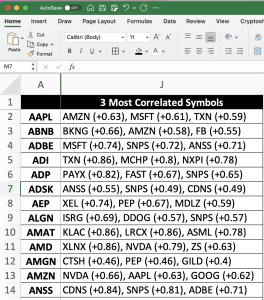
Take a look at the three most correlated stocks for every stock in the Nasdaq 100. We are using our massive correlation matrix for every stock and ETF that we could find (roughly 35,000). We update this matrix once per week. No small feat considering it is (35,000^2)/2 – 35,000 = 612 million pairs of correlations. How might you use this new stat? First, it can help to find new comparisons/relationships between stocks. Second, it can be used to find hedge-able relationships. We will be including this stat more in the future.
Download the list HERE.
Historical Volatility and Implied Volatility
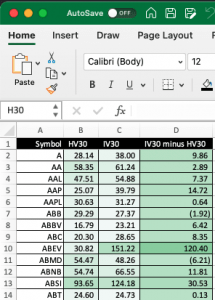
Last week’s Cherry Picks really created excitement! We provided 1100+ stocks and ETFs along with their historical and implied volatilities.
To download an updated spreadsheet, click HERE.
Interesting Graphic for FB
We pulled the net income of Facebook/Meta and plotted over the stock price. Interesting about the huge decline in price during its last earnings announcement, while net income still increased. We aren’t stating anything about the long term prospects of Meta, only that it still prints money.

The free weekly Cherry Picks newsletter from tastytrade is stuffed with market research studies, data-driven trade ideas, and unique insights from the geekiest of geeks. Conquer the market with confidence … get Cherry Picks today!
Cherry Picks is written in collaboration with Michael Rechenthin, PhD, Head of Research and Development at tastytrade; and James Blakeway, CEO of Quiet Foundation, a data science-driven subsidiary of tastytrade.