Inversion in Treasuries: Two Ways to Trade
A savvy futures trader’s take on the markets
Rip van Winkle slept for 20 years, but that was 200 years ago. Today, van Winkle’s smart phone would probably disturb his slumber after a mere 12 years.
So suppose the Washington Irving character nodded off back in 2007 and awoke last month. He would have been greeted with the same news upon awakening that was roiling the markets when he went to sleep: Yield curve inversion.
On Wednesday, Aug. 14, an uncommon event shook the bond market. Longer-term interest rates fell below shorter-term interest rates, causing a tizzy in the financial markets.
“Tizzy” isn’t listed among the 2,500 words in the Dictionary of Economics, but it’s probably what old Rip would have called the state of mind that gripped the investment community.
More than a few investors found themselves in a tizzy simply because they didn’t understand yield curve inversions. But they shouldn’t feel bad. Most economists can’t explain the phenomenon, even though they chatter incessantly about it.
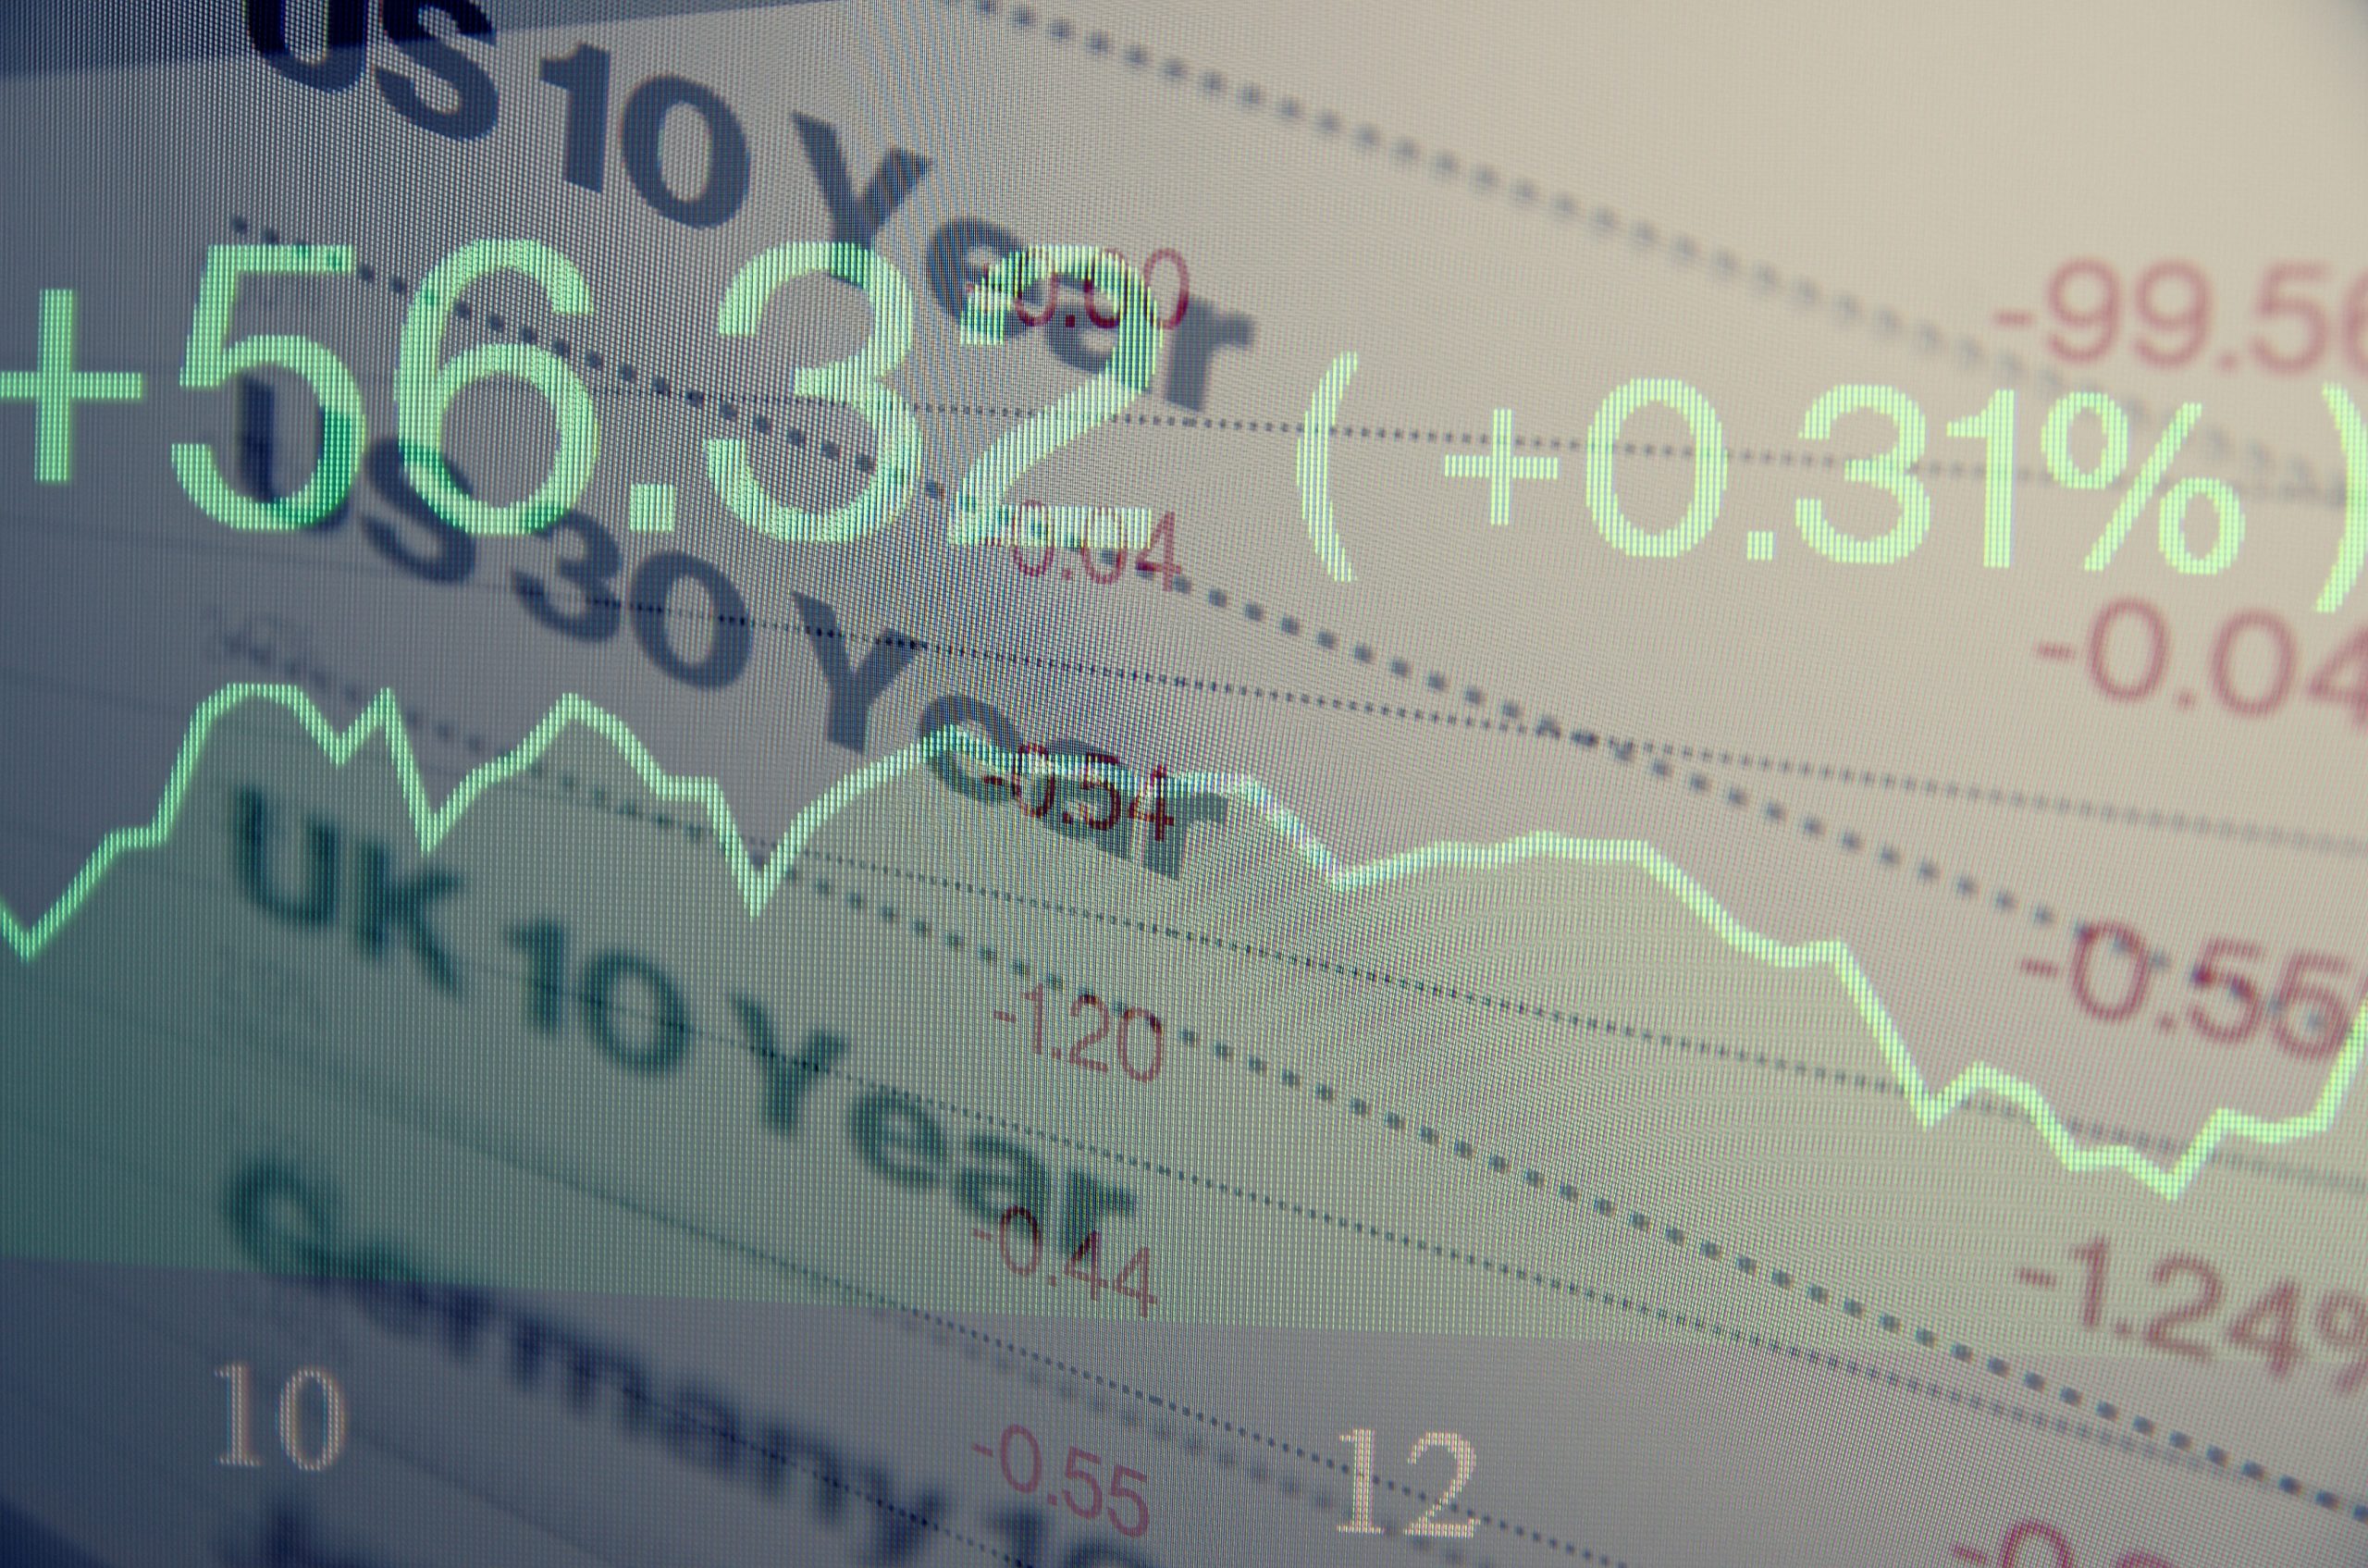
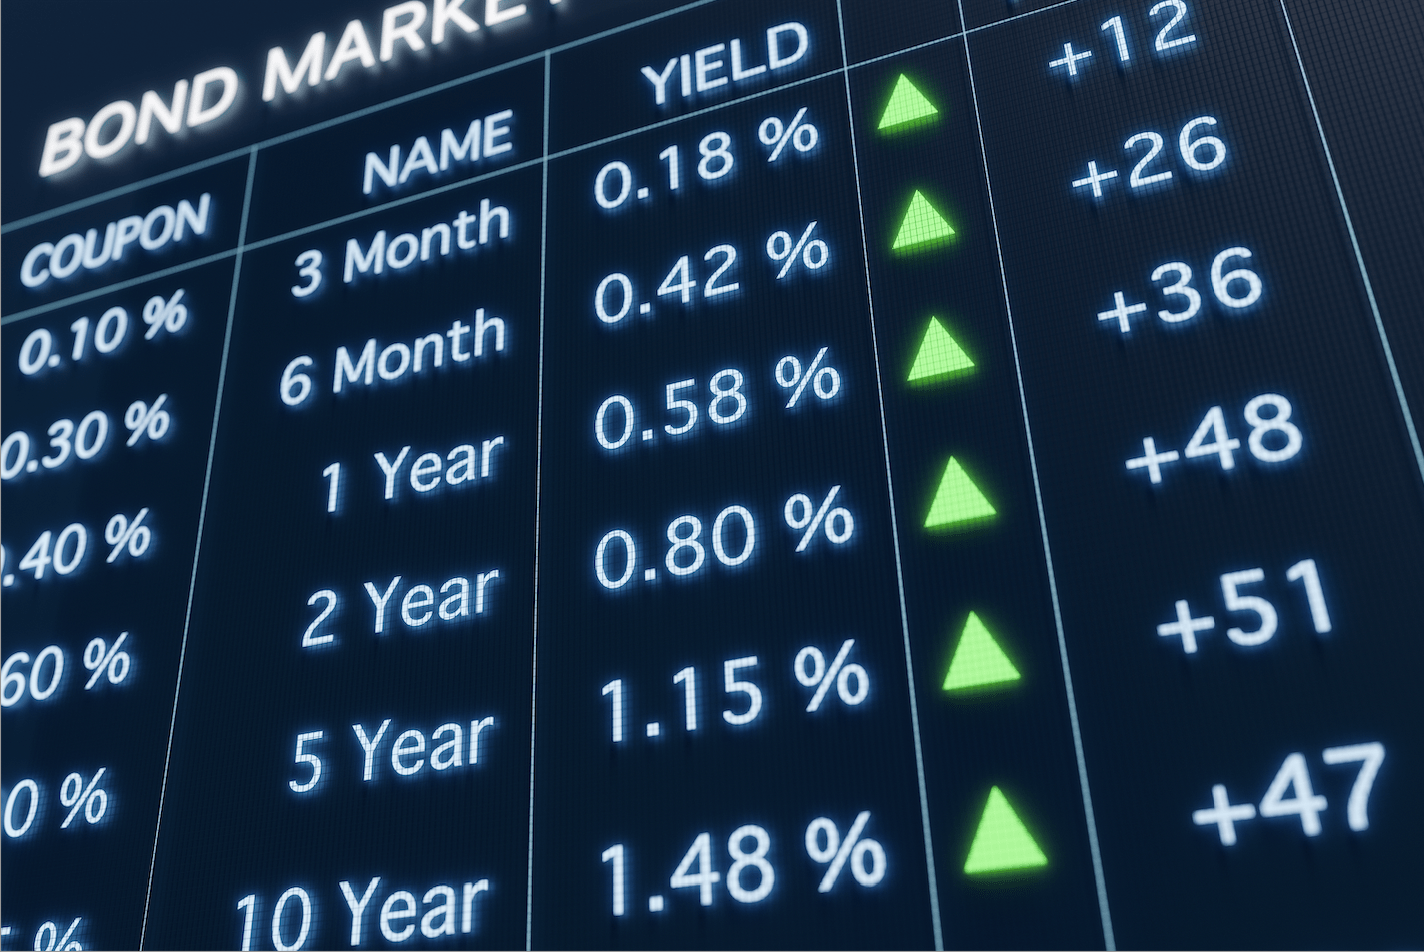
Still, it’s really not that complicated. Subtract the yield of the 2-year Treasury note from the the yield of the 10-year Treasury note. Inversion happens when the 2-year yield is higher than the 10-year yield and the calculation results in a negative number. (See “What is it?” below.)
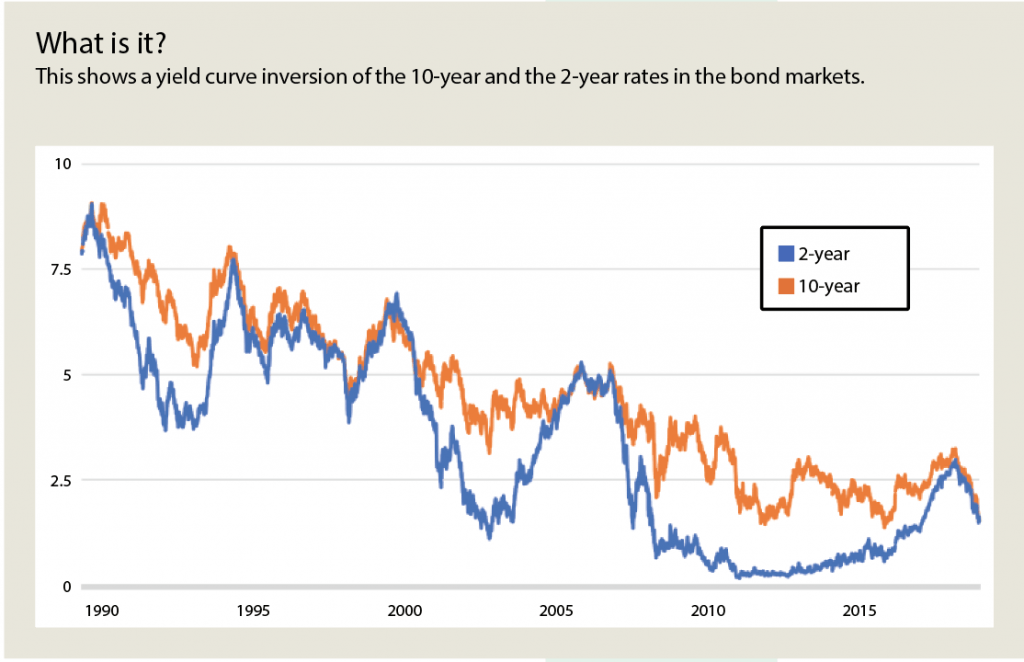
In other words, longer-term interest rates fall below shorter-term interest rates. The problem is that this situation typically means that a recession could be on the way.
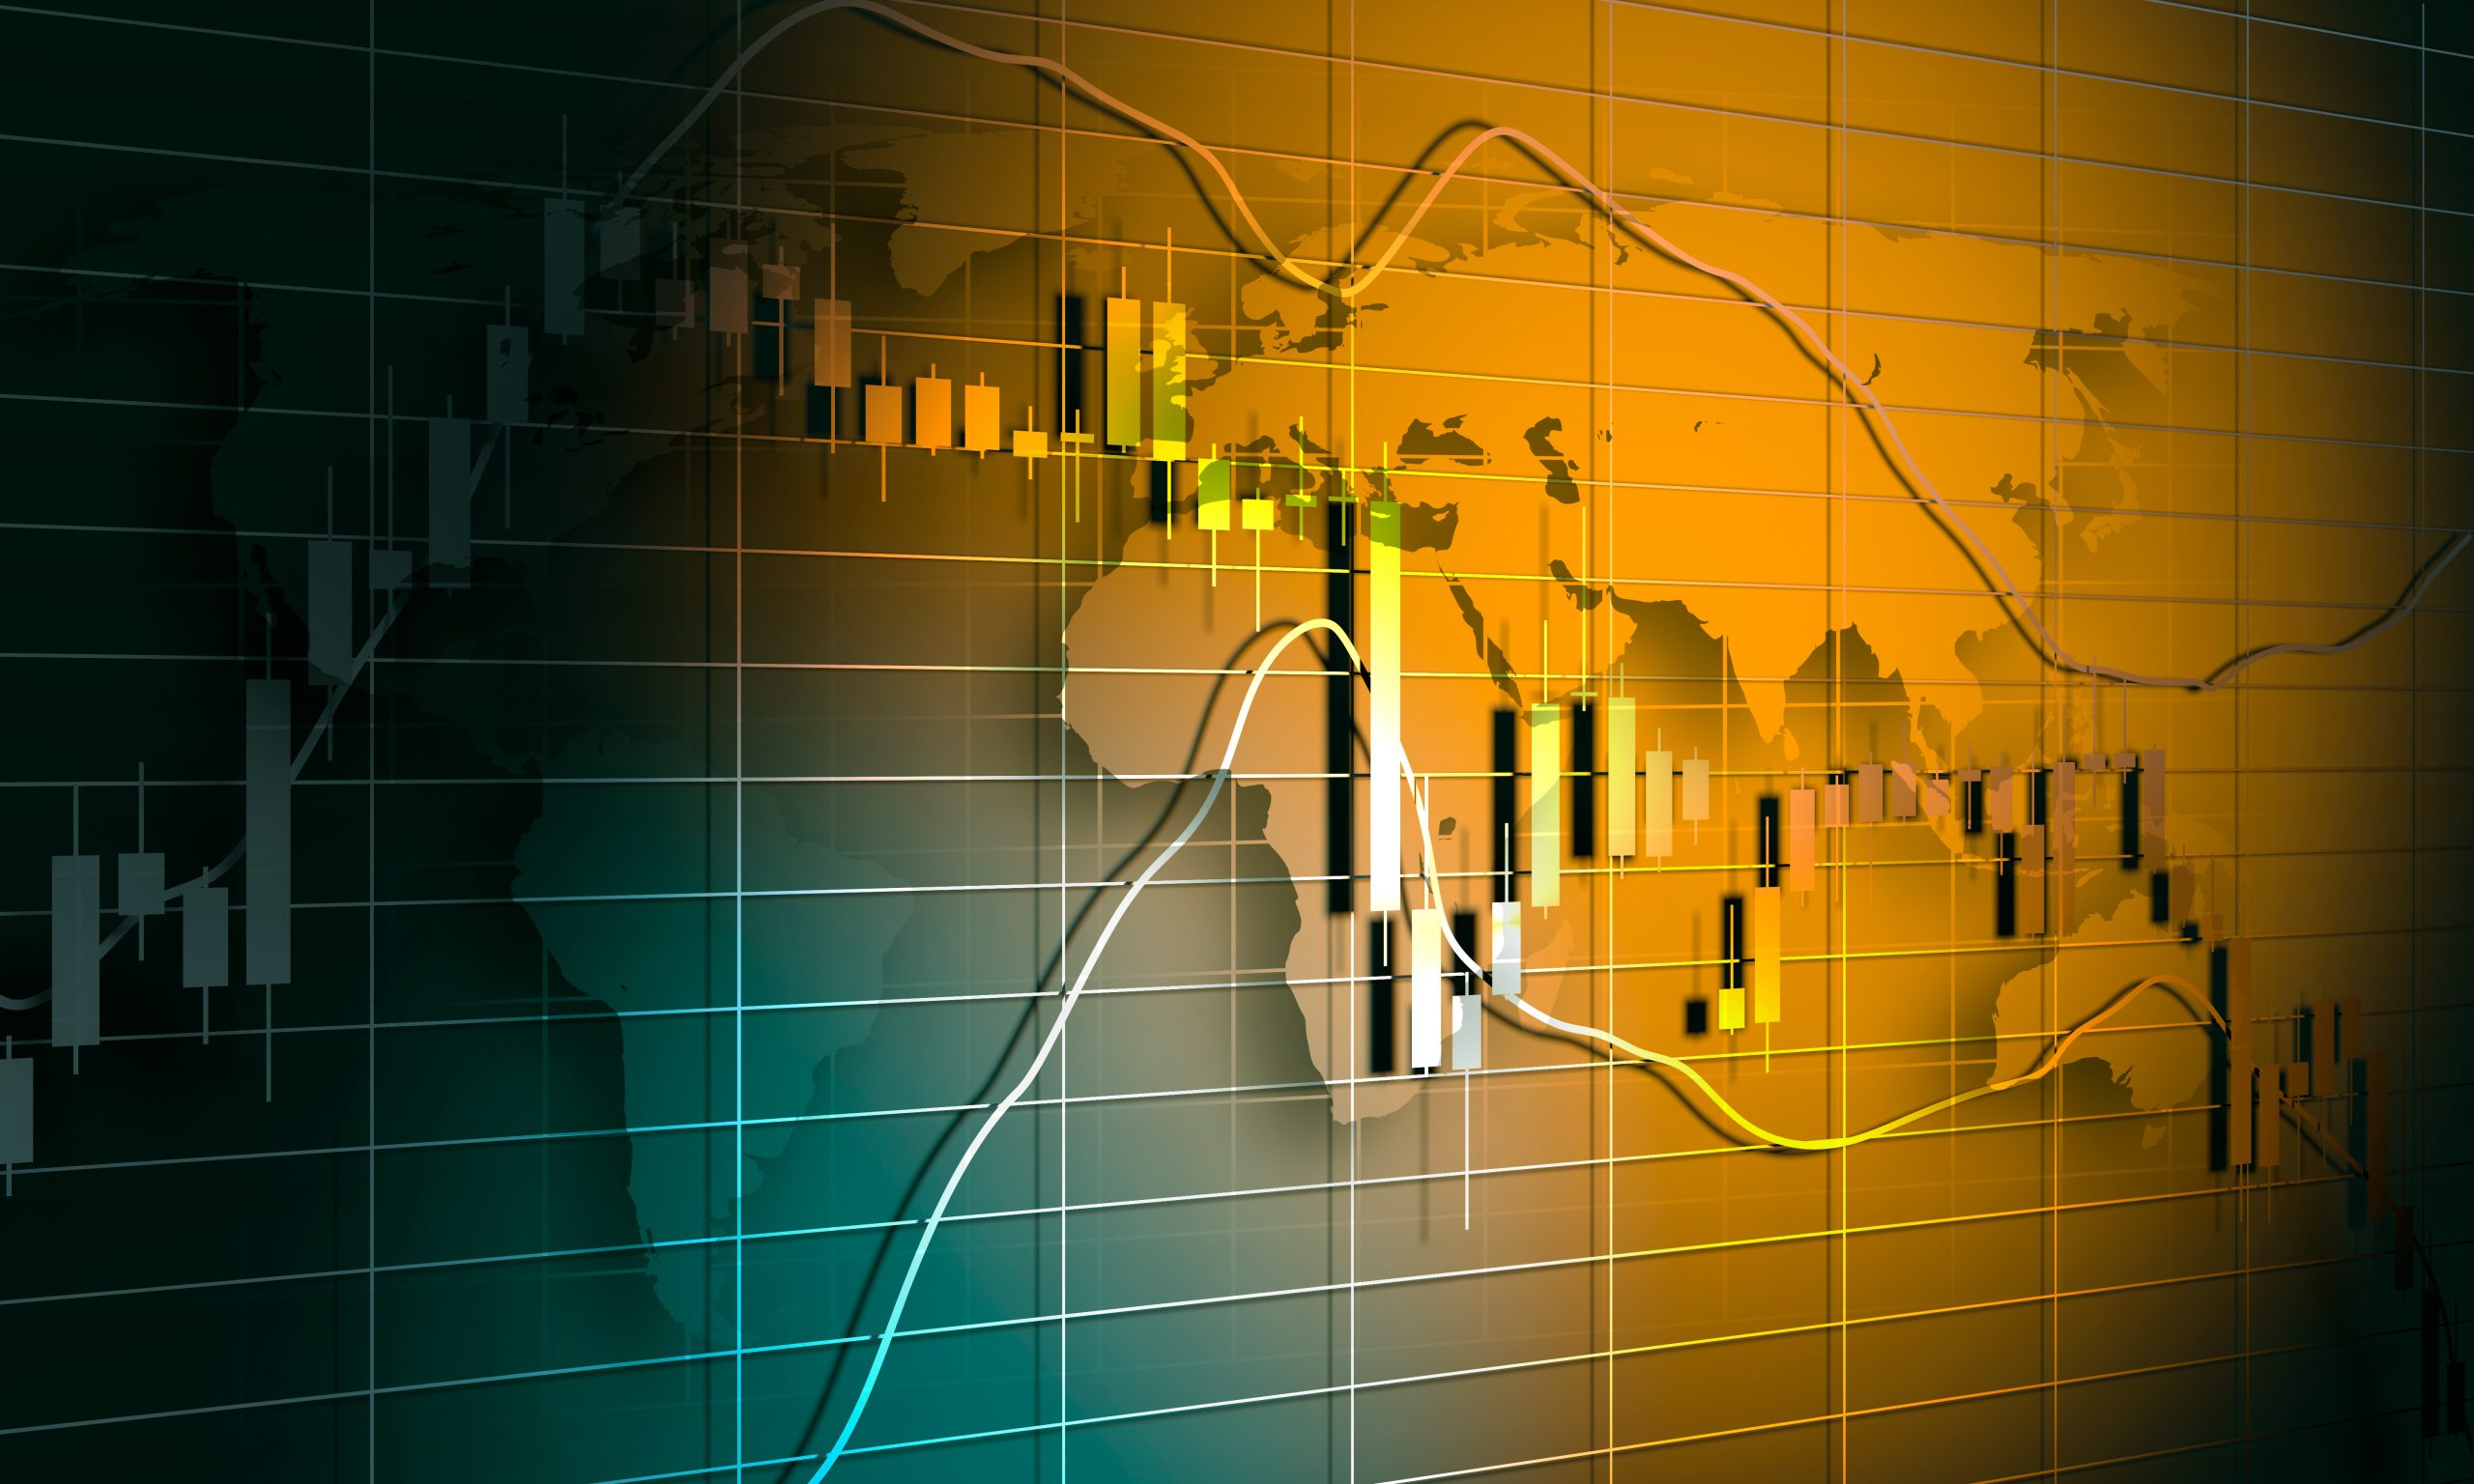
The yield curve is the yield of Treasury bills, notes and bonds plotted against their maturity. Normally, short-term debt instruments have a lower yield than long-term debt instruments of the same credit quality. That gives the yield curve an upward slope that’s called a positive yield curve. That’s how the curve usually looks, so a yield curve inversion attracts plenty of attention.
Interest rates are closely connected to the rate of economic growth and inflation. In boom times, lots of people want to borrow money to expand their businesses or buy houses. And the Federal Reserve raises the interest rate to prevent the economy from overheating and causing inflation. When a slowdown comes, the process works in reverse.
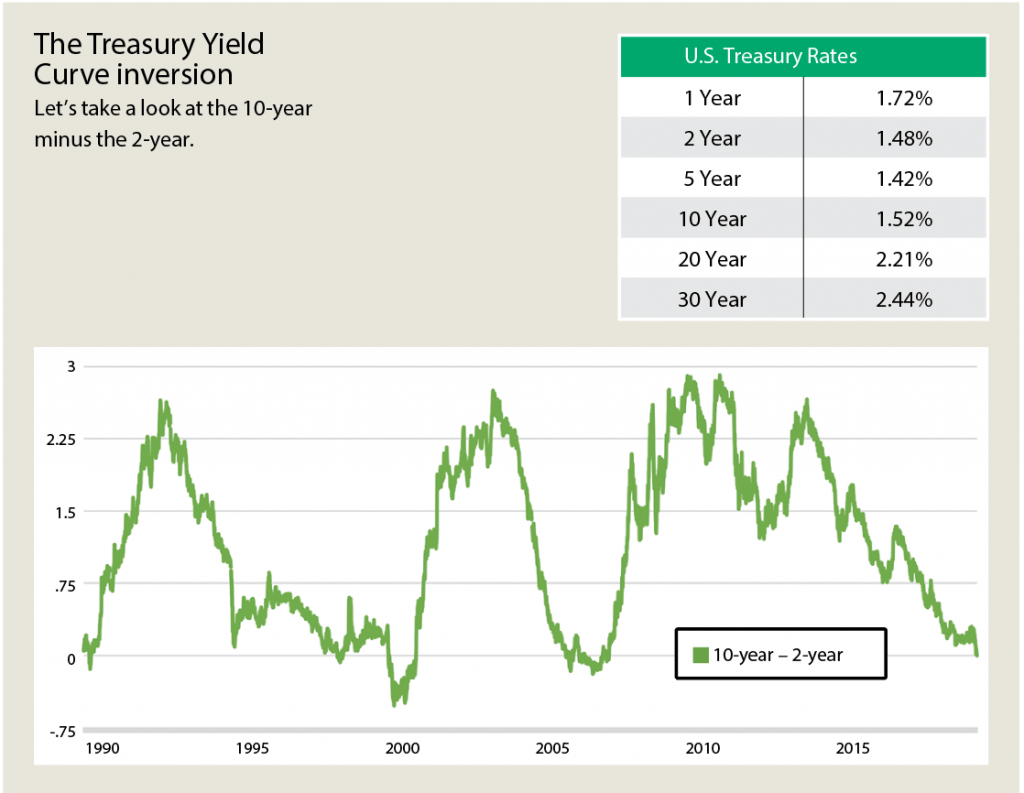
Take a look at “The treasury yield curve inversion,” above. What does a yield curve inversion mean for the market or for the economy? Note the following two factors:
• Inversion usually arrives on the back of an increase in short yields, which comes from Fed activity, and stagnant long yields; and
• Inversion tends not to last long, and it tends to be followed by lower yields across the curve.
What do yield curve inversions mean for stocks? 1) Stock prices aren’t immediately influenced; 2) Discouraging economic data usually comes to light during or after an inversion; and 3) Large downturns in stocks and economic recessions have followed yield curve inversions with a lagged effect.
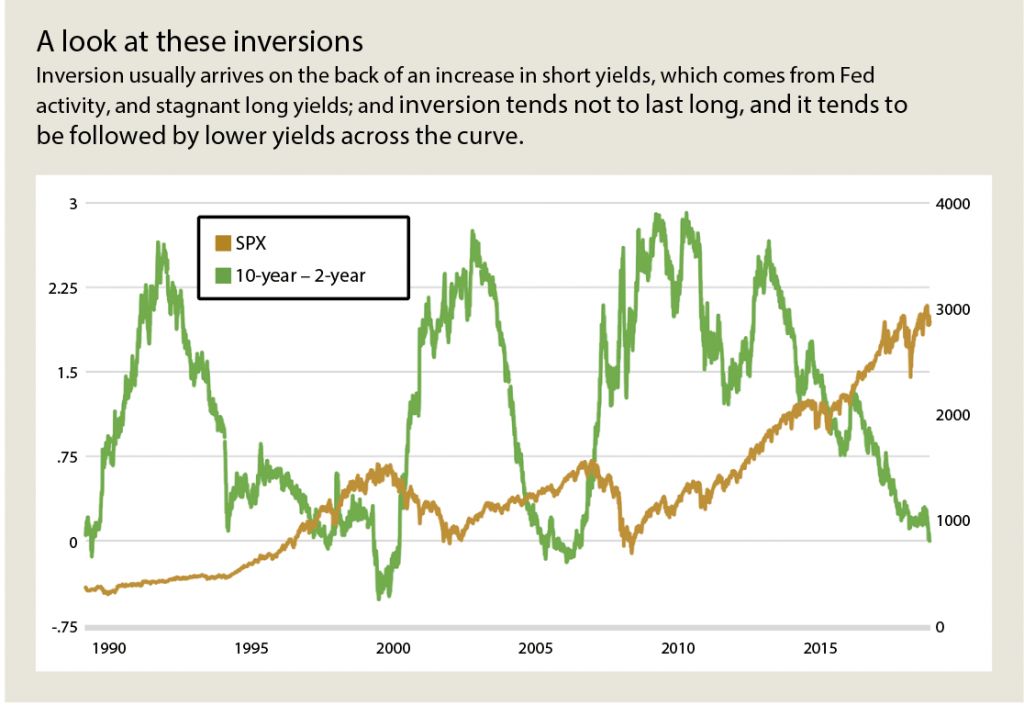
The chart “A look at these inversions,” below, shows the 10-year minus the 2-yr, and on another axis, the S&P 500. The chart shows how long it took for the market to sell off and begin rallying again. It also shows how long it took for the S&P 500 to correct.
Another chart, “Statistical history,” below, quantifies the relationship between yield curve inversion and how long it took for the S&P 500 to correct. Note that the lag time is inconsistent, ranging from two months to 23 months, and that the yield curve has seldom inverted in the last 50 years.
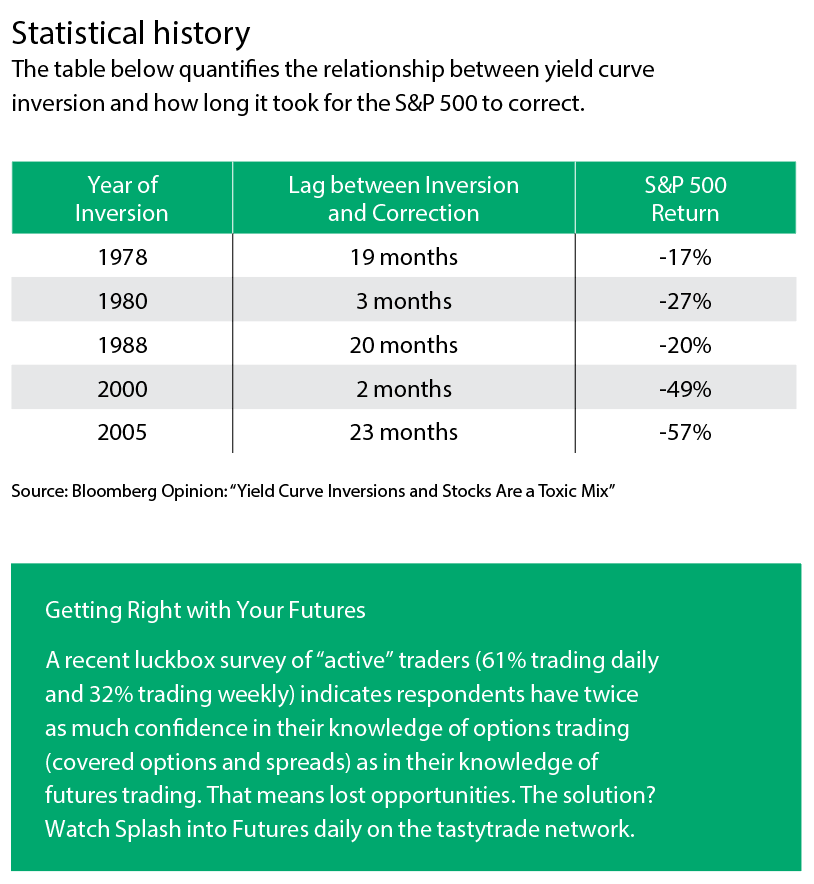
While recessions have occurred after recent yield curve inversions, they have not happened immediately, and the lead time has been inconsistent. Historically, a recession can come from one to two years after the curve flips upside-down, and the stock market usually continues to gain from the day of the inversion until its cycle peak. Also, five points aren’t enough for a reliable data set. So, it’s hard to predict what might happen to the market or the economy.
There are a couple trading takeaways, though. Investors who think the inversion won’t last long and that the 10-year yield will soon climb back above the two-year yield could consider a short 10-year note future (/ZN) versus a long two-year future (/ZT). The trick is to get the ratios right.
Investors who think short-term rates might stay high (and that longer-term rates will go higher to get the yield curve back to normal), could put a damper on share buy backs that have become popular in some of the bigger stocks. That could, in turn, put downward pressure on the S&P 500. So, investors may want to fade market rallies with bearish strategies.
Now shrug off the yield inversion tizzy and get back to trading.
Pete Mulmat, chief futures strategist at tastytrade, serves as host for a number of daily futures segments on the tastytrade network under the flagship programming slot called Splash Into Futures.