Stalking the Soybean-Corn Ratio Amid Falling Corn Prices
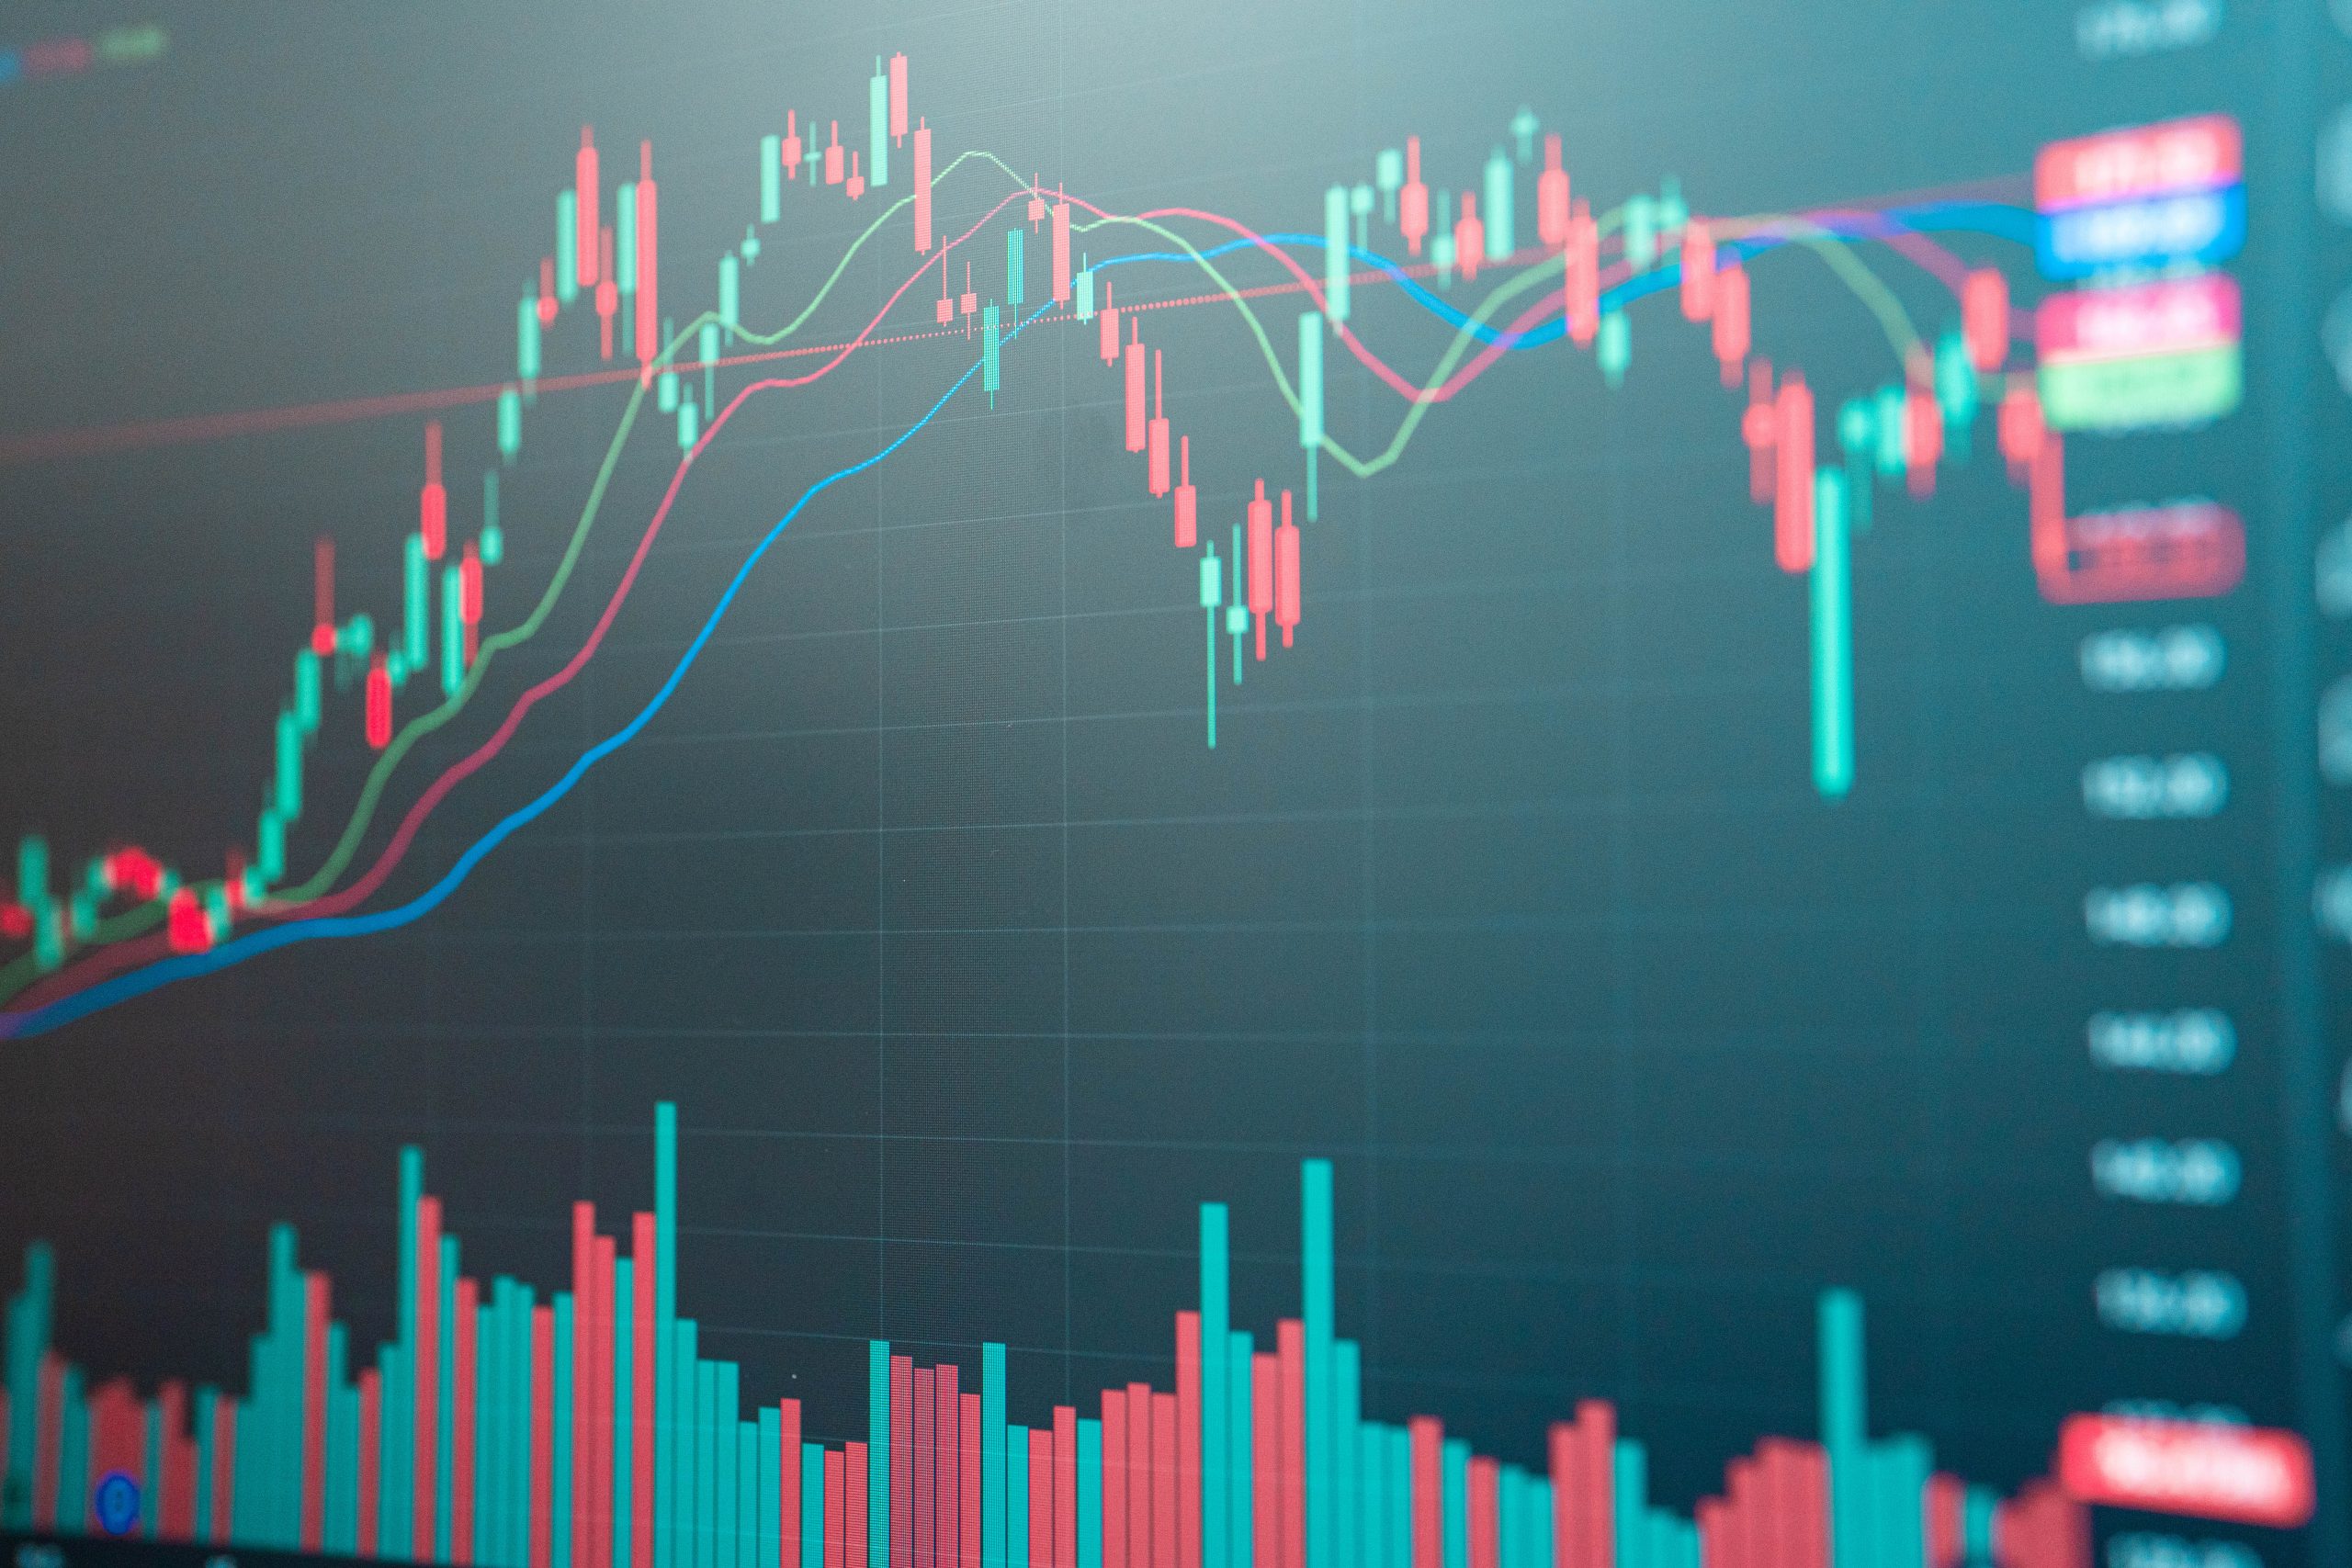
While cryptocurrencies have become synonymous with extreme volatility, the year 2019 has seen many “old school” trading products see a noticeable uptick in daily movement.
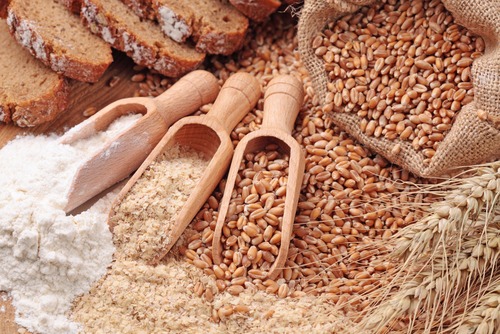
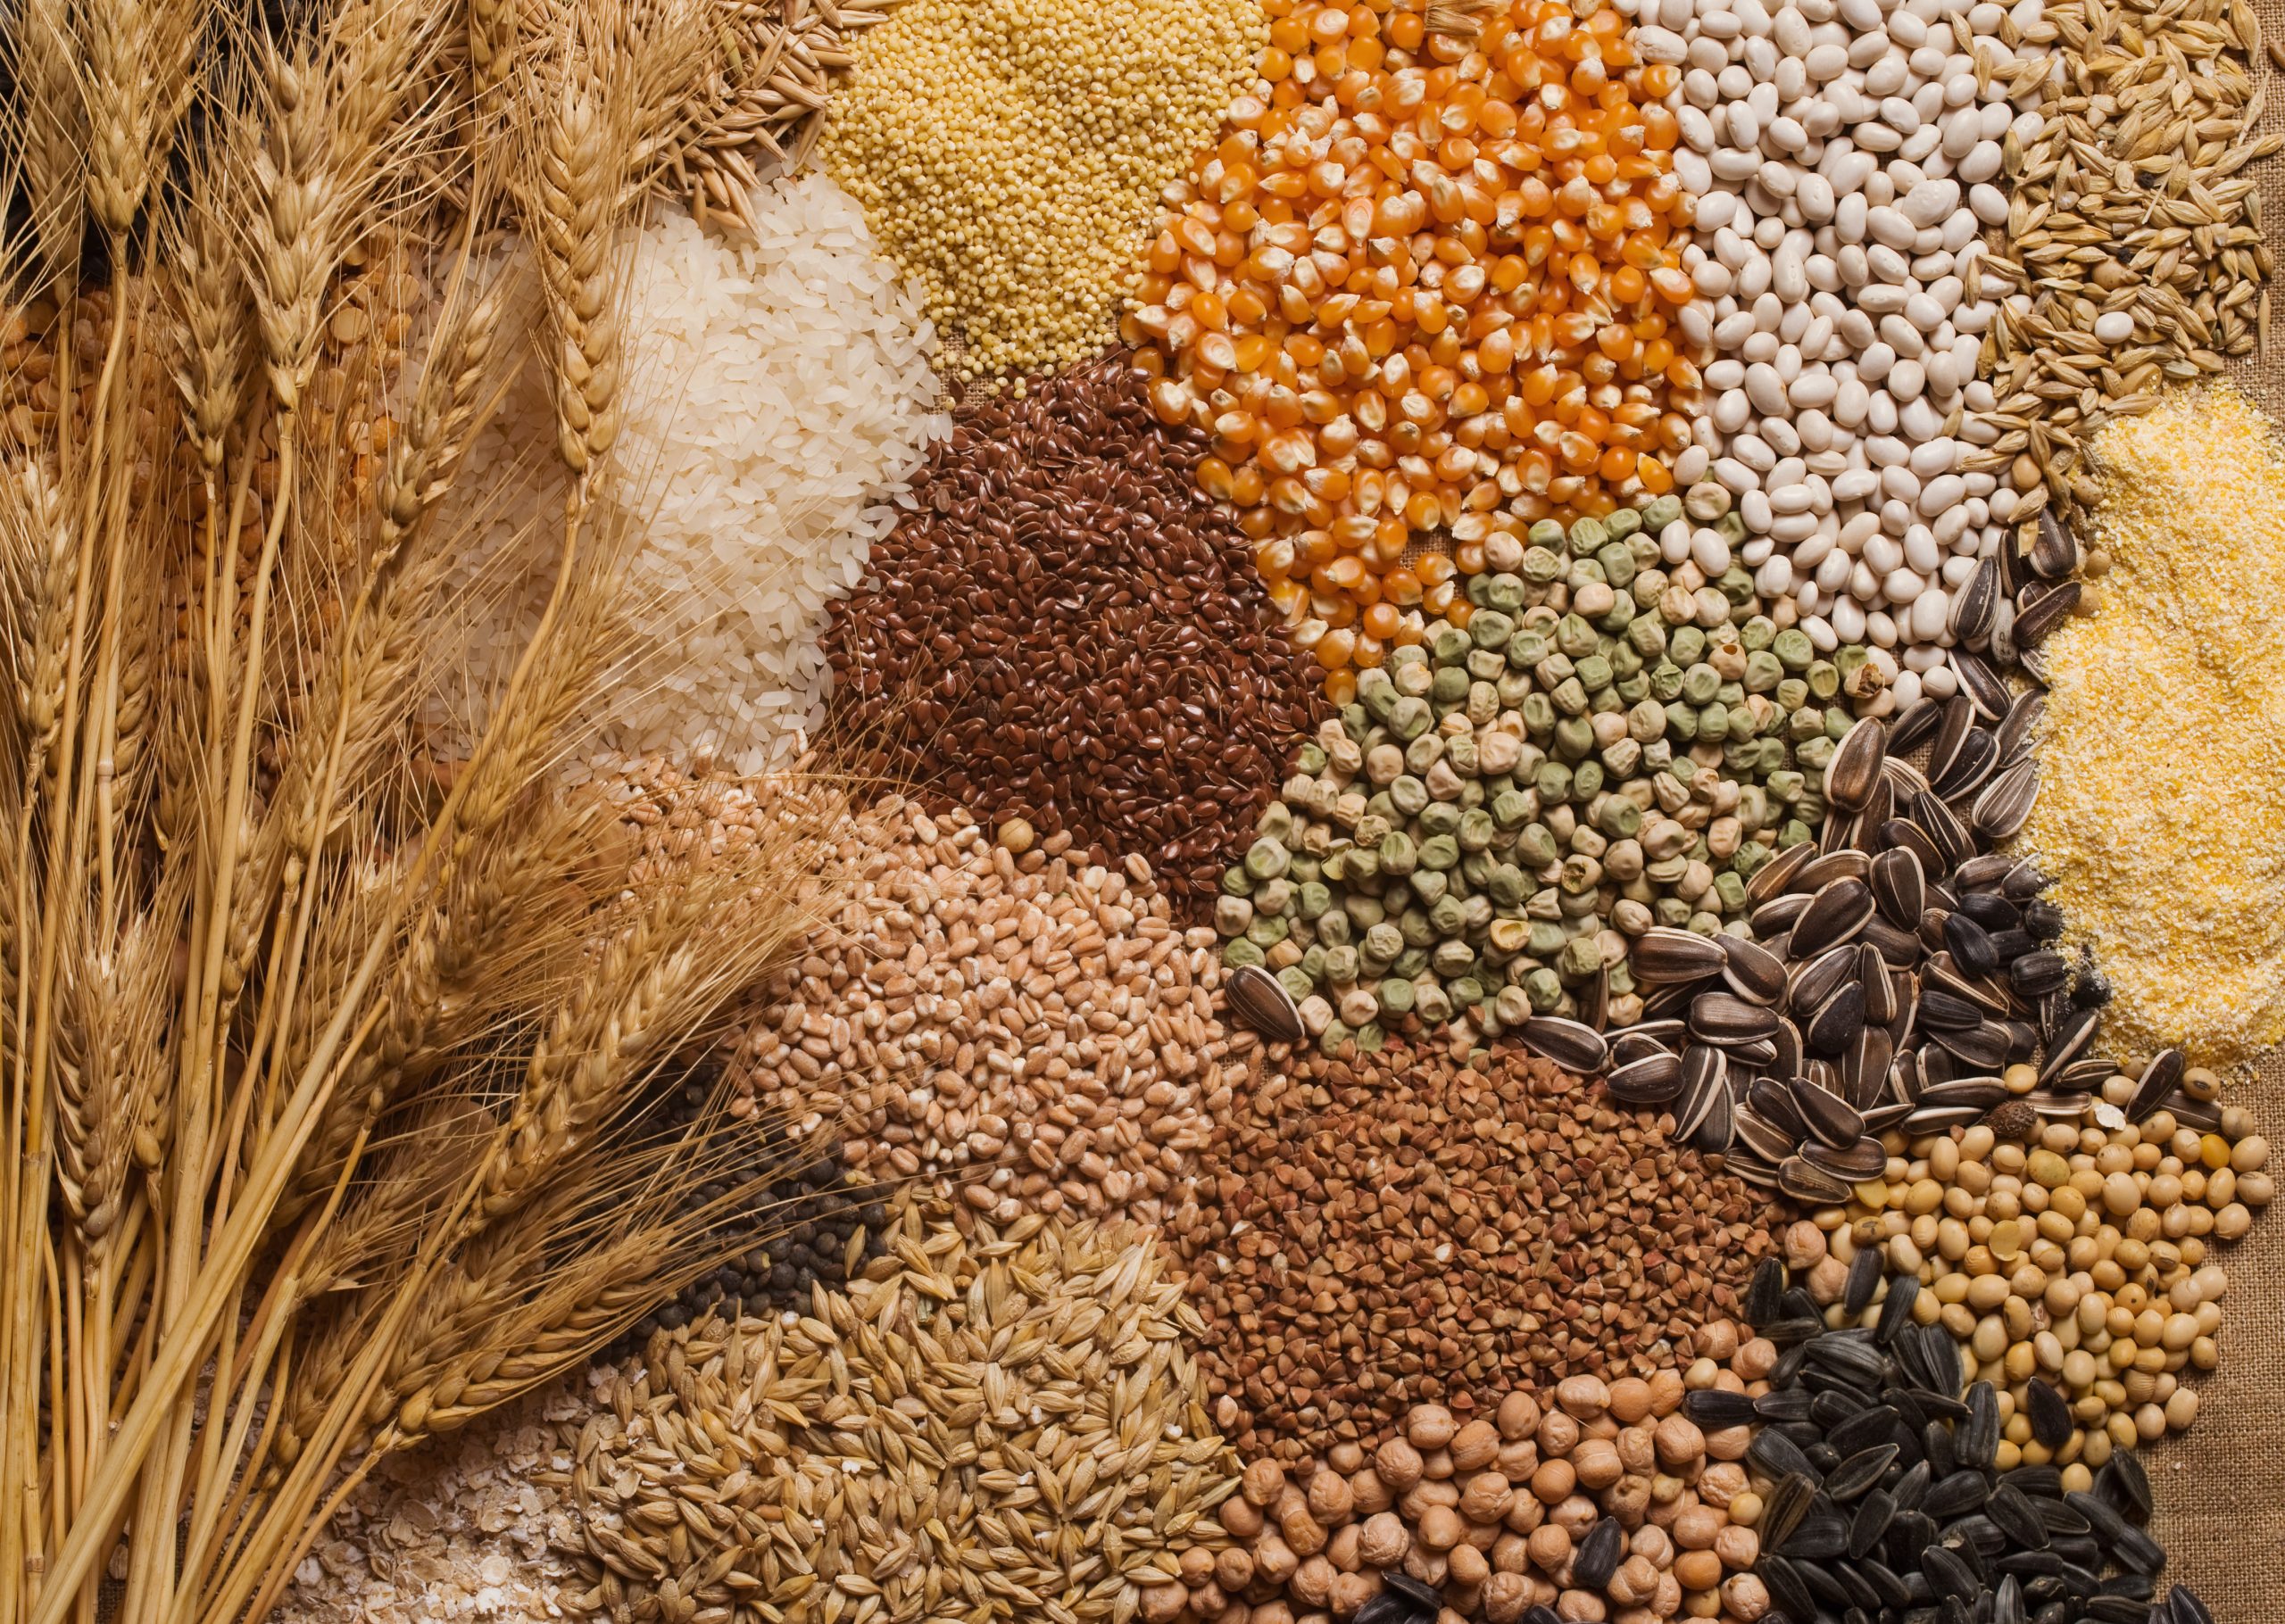
At the top of this list, in terms of shock value, has been the increasing volatility exhibited in many agricultural commodities, like soybeans, wheat, and corn.
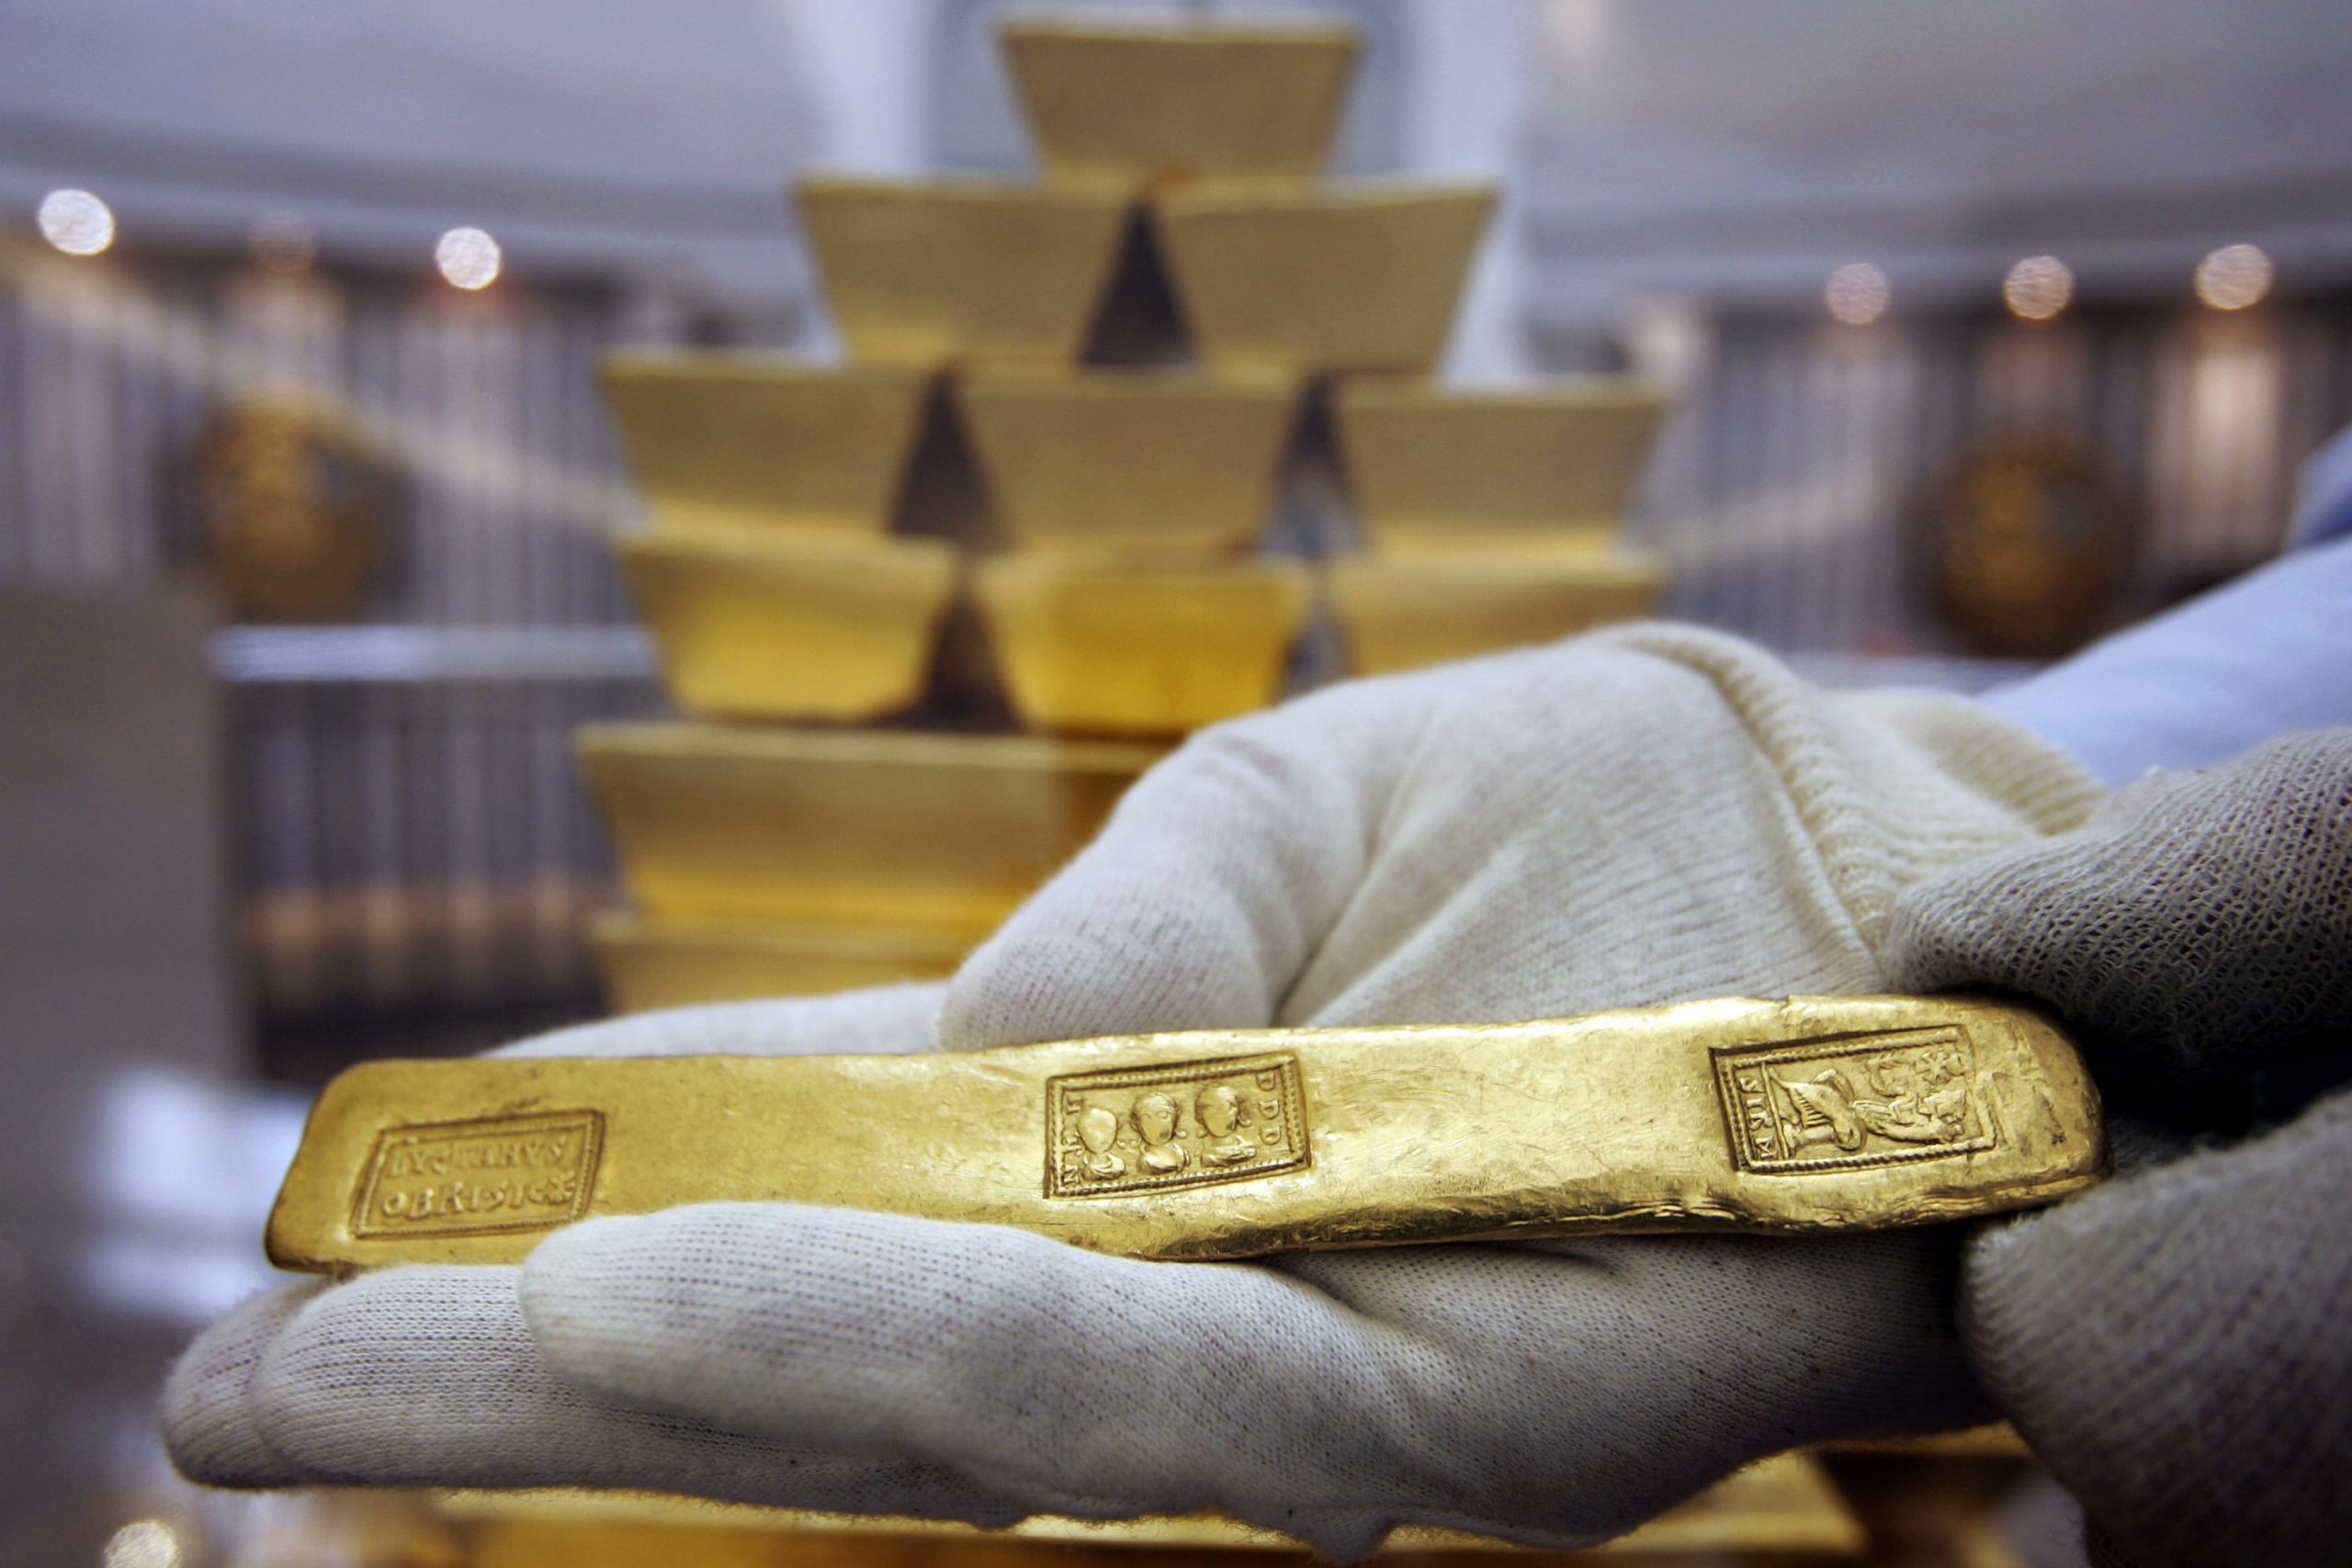
Agricultural products such as these might even be best described as “original school,” as food staples such as rice and corn can be traced back to some of the oldest records in commerce/trade history (along with gold and silver).
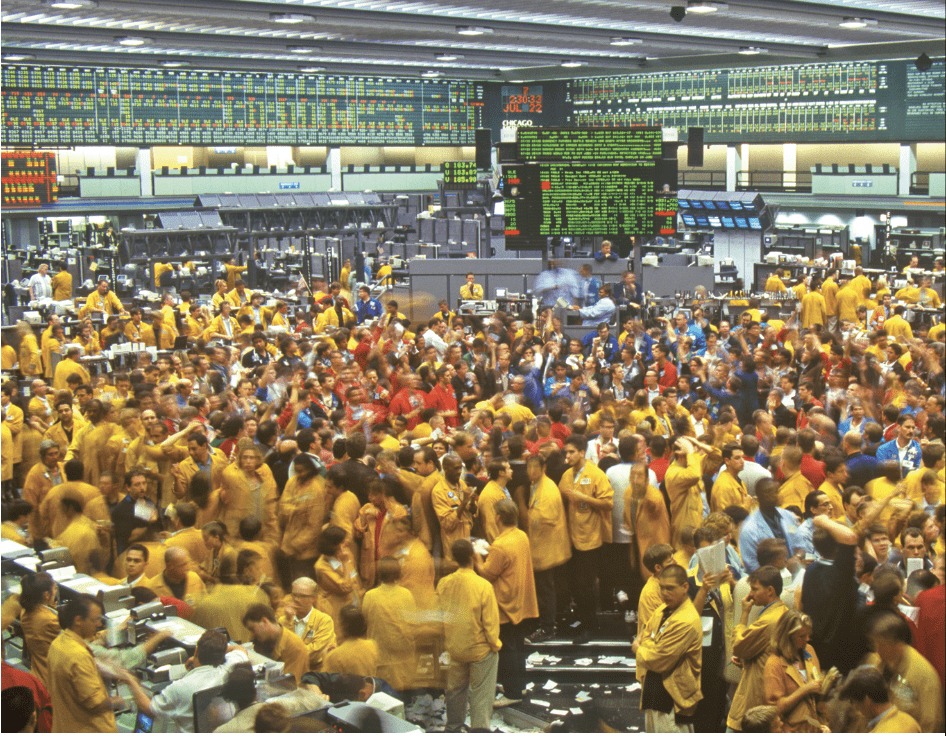
For example, corn was one of the first-ever products traded as a “future” on the Chicago Board of Trade (CBOT), which was founded in 1851. Rice futures trading is known to have occurred in Japan more than two hundred years before the founding of CBOT.
In a throwback to yesteryear, corn trading was of particular interest during the second full week of August, when futures plunged to the maximum exchange daily limit of 6% on August 15 – capping its worst single day in approximately six years. Prices for corn are now closing in on the lowest levels observed in 2019 – about $3.62/bushel (the low for the year was $3.47).
That’s down significantly from the $4.50+/bushel prices that were celebrated by farmers earlier in the summer.
So what’s been causing all the chaos in what has usually been a more muted market in terms of volatility? The “trade war” between the United States and China is one big reason. However, weather and associated yield forecasts have also catalyzed a lot of the volatility.
Going back to the start of 2019, the slide in corn prices was mostly attributable to the trade war. Especially because it was still winter in the United States—this means weather forecasts weren’t yet a major factor. At that time, the drop in prices was linked to lowered demand expectations, due to the stifling of global trade.
However, in early spring, the weather and crop yield narrative took over—convincingly.
Due to the inordinate amount of rain that fell in the United States in spring, combined with the melting of significant winter snow accumulation, a great many of the agricultural fields in the United States weren’t fit for early planting. As a result, forecasts for crop yields across the spectrum of the agricultural universe dropped considerably.
As noted earlier, corn prices are extremely sensitive to supply and demand considerations. So when supply forecasts were lowered across the United States, corn prices experienced a strong lift–gliding from about $3.50/bushel all the way up to $4.55/bushel in June/July.
Unfortunately, the optimism didn’t last, and the corn narrative has turned decidedly bearish in the last several weeks. Corn has, in fact, basically retraced its entire bull run. And this time, both narratives worked in tandem to push prices lower.
First, trade war optimism evaporated when President Trump announced at the start of August that the United States was planning a new round of tariffs on Chinese imports. Shortly thereafter, China announced it would suspend virtually all purchases of American farm production. A bearish signal for American “ags” if there ever was one.
As if that wasn’t bad enough, the United States Department of Agriculture (USDA) came out with a report in mid-August that suggested the corn harvest would be unexpectedly robust in 2019, which is a much more optimistic report (in terms of total corn supply) than what had been forecast in spring.
It was that report that kicked off the 6% selloff on Aug. 15, and effectively drove the last nail in the corn coffin—at least for now.
For U.S. farmers already hurting from the trade war, it hasn’t helped that bumper crops are also being reported in other parts of the world. Two other major world producers, Brazil and Ukraine, have indicated in recent weeks that crop yields are looking very strong.
While the uptick in volatility has been terrible farmers, recent moves in agricultural futures have opened up a multitude of new trading opportunities for investors, especially of the active variety. Aside from the case for a simple contrarian position in corn, the spike in the implied volatility has also made short premium opportunities in futures options look a lot more attractive.
However, traders need to beware that the volatility may have only just begun, and strategize accordingly.
Any nugget of news that indicted an end to the trade war could be on the horizon would undoubtedly catalyze a spike in corn prices – and many other commodities along with it. Therefore, traders that are more risk averse may want to consider position structures with less naked directional risk, such as a pairs trade.
Pairs traders involved in agricultural commodities often monitor the Soybean-Corn Ratio, much like precious metals traders follow the Gold-Silver Ratio.
As with the Gold-Silver Ratio, the Soybean-Corn Ratio is calculated by simply dividing the price of soybeans (per bushel) by the price of corn (per bushel). Soybean prices have also been suffering due to the trade war, and are currently trading about $8.57/bushel – meaning the Soybean-Corn Ratio currently stands at roughly 2.4 ($8.57/$3.62 = 2.37).
Looking at the history of the Soybean-Corn Ratio, it tends to range between about 2 and 3. In late spring, the Ratio was pushed all the way down to 2 for the first time since 2013. If the ratio were to trend toward one of those extremes in the coming weeks/months, traders might consider playing a reversion in the ratio through a pairs trade involving the two futures.
For example, if the ratio dropped back to 2, and a trader playing a reversion might consider purchasing the numerator (soybeans) and selling the denominator (corn). Such a position benefits when the ratio rises, either through an increase in the price of soybeans, or a decrease in the price of corn (or both).
The reverse position could be considered if the ratio traded all the way up to 3. Short soybeans against long corn would theoretically benefit with a downward move in the ratio.
By pairs trading two underlying products that are highly correlated, traders can remove the vast risk represented by a naked directional position, and instead try to capitalize upon the “price extreme” presented by the market.
For more information on trading price extremes using the pairs strategy, traders are encouraged to review a previous installment of Best Practices on the tastytrade financial network titled “Step-by-Step Pairs Trading.”
Additional information is also available in the tastytrade LEARN CENTER.
Sage Anderson is a pseudonym. The contributor has an extensive background in trading equity derivatives and managing volatility-based portfolios as a former prop trading firm employee. The contributor is not an employee of luckbox, tastytrade or any affiliated companies. Readers can direct questions about any of the topics covered in this blog post, or any other trading-related subject, to support@luckboxmagazine.com.