Auto Industry Autopsy
If the average age of a car on the road increases 15% every 10 years, half a century from now the average car would be 23 years old and might have more than 300,000 miles on the odometer—if any cars are still left.
In the ’60s and ’70s, motorists could only dream of a car reaching 100,000 miles before it was replaced or needed to spend two expensive weeks in a repair shop. Back then, the relatively primitive state of automotive technology produced cars that just didn’t last that long.
Now, it’s new world. If a Toyota has 170K on the odometer, it will likely do another 30K. Shopping for a vehicle for their kids, parents see cars with 120K on the clock that still look good and seem mechanically solid. While 100K used to represent a major milestone for a car, 200K seems like a reasonable expectation now. But what’s the probability of a car reaching that mark?
Unfortunately, the markets don’t offer options on cars that would enable investors to derive actual probabilities like the ones that exist for stocks and market indices. But the U.S. Department of Transportation does have some historical data for the average age of cars on the road. Back in 1970, the average age of a car was 5.6 years. In 1980, it was 6.6 years. In 1990, it was 7.6 years. In 2000, it was 9 years. In 2010, it was 10.8 years, and in 2018 it was more than 11. That means the average car today could have about 155K miles on it, assuming 13.5K miles per year. With some regular maintenance, 200K seems like a 50/50 bet.
To quantify that, the average age increased 17.8% from 1970 to 1980, 15.2% from 1980 to 1990, 18.4% from 1990 to 2000, 20% from 2000 to 2010, and 3.7% from 2010 to 2018. Has the growth in car longevity slowed down? Maybe, but if every 10 years the average age of a car increases 15%, in 50 years a car could be 23 years old with more than 300,000 miles on it. That’s a lot of time to accumulate stains from fast food wrappers and spilled sodas. Better load up on the Scotchgard.
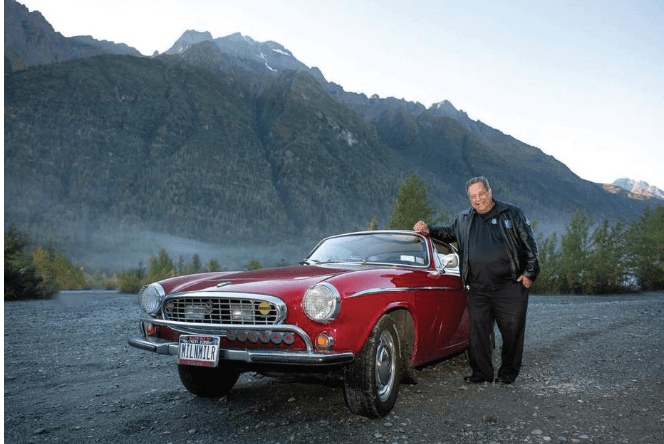
Cars are indeed built better than they were 50 years ago, and motorists who buy used vehicles should get their money’s worth if they drive until the wheels pop off. Isn’t that what Warren Buffett does? But with better cars lasting longer, it’s no wonder that Americans are buying fewer of them and car dealers are sitting on inventory. And millennials, who take email, ATMs and smart phones for granted, may take Uber or Lyft for the rest of their lives and let someone else buy the cars. What, then, will become of the automotive industry?
Of the major car stocks, Toyota (TM) has the largest market cap at $184 billion. The others, like Ford (F), General Motors (GM) and Tesla (TSLA), have market caps from $35 billion to $52 billion—which pale in comparison to stock market leaders with market caps nudging the trillion dollar mark. The days when car manufacturers dominated U.S. business are over. Even electric cars are really an energy thing, not a car thing. Millennials won’t need to buy electric cars, either.
So is it time to become a perma-bear on car stocks? Investors can attach a probability to that. The probability that any of them will be 15% higher at the end of the year is lower than the probability that they’ll be 15% lower. At the time of this writing, the probabilities of being 15% higher or 15% lower respectively are 13% and 23% for General Motors, 10% and 25% for Ford, 28% and 38% for Tesla, and 7% and 13% for Toyota. That’s a fairly significant bias. So, even investors who don’t want to short car stocks should be cautious buying them. Regardless of what they may think of their prospects, the market is seeing more risk to the downside. Car bulls, buckle up.
Tom Preston, luckbox features editor, is the purveyor of all things probability-based and the poster boy for a standard normal deviate.