Counting on Volatility
Scientists can only guess when the next pandemic or earthquake will strike, but with the help of volatility traders can quantifiably predict stock prices

The year 2020 will be remembered as tumultuous. With COVID-19, civil unrest and a highly emotional and consequential election, it’s a wonder anyone had time to look at the market. But predicting those events is almost impossible. You might have full confidence in a lethal epidemic occurring at some point in the future, but making a quantified estimate of when COVID-19 might have happened is really just a guess. What many people don’t know is that money and investments are more predictable than other types of events.
What makes markets different than other events? What enables traders to predict where markets will be in the future? Quantifiable volatility. What’s that? Volatility means how much something changes from an average, and we can stick a number on it. Volatility is just another term for standard deviation. If we can measure the changes and determine the average, we can get a quantifiable volatility. That’s pretty easy to do with markets, but not so easy with epidemics or elections. The reason is that epidemics and elections don’t happen very often, making it difficult to determine an average and deviations away from that average. Scientists try, and we hear about how we’re “overdue” for an outbreak or an earthquake. Then we wait for California to snap off the left edge of the United States, but it doesn’t. At least not yet.
On the other hand, the stock market can give immediate feedback on whether a prediction is correct. We can use the quantifiable volatility of Apple (APPL) stock, for example, to see what the probability is that it will be above or below some price by the end of 2021, or next month, or next week or tomorrow. Then we can see at that particular date whether the price of stock in Apple is actually above or below those predicted levels. The volatility of a stock is determined by its options’ prices, which are determined by all the buyers and sellers in the market. The market sets the option prices, and a stock’s volatility can be derived from them.
Think of volatility as just another term for standard deviation.
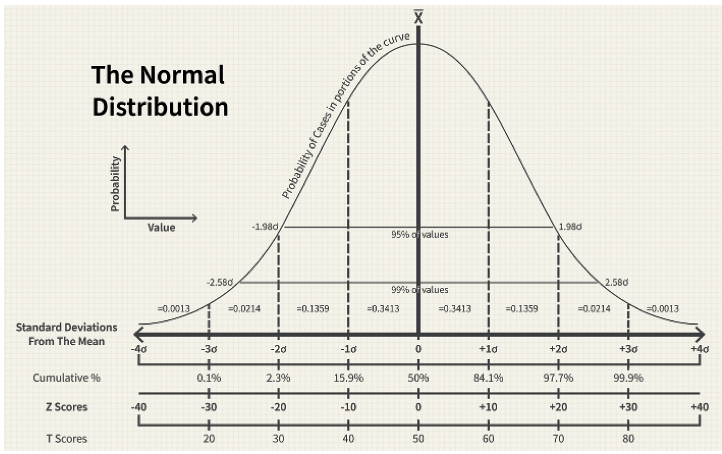
An important thing to know is that a stock’s volatility is an annual number. For example, if Apple has a volatility of 30%, the market predicts there is a 68% probability that it could change 30% or less—up or down—in one year. The 68% comes from the area of the bell curve that ‘s between one standard deviation below the average and one standard deviation above the average. But to see the probability of what Apple’s price might be in less than a year, convert Apple’s annual volatility into the volatility of a shorter time frame. To do that, multiply the annual volatility by the square root of the fraction of the year you’re considering.
For example, if you want to estimate how much Apple might change in 60 days, multiply 30% by the square root of 60/365. That gives you about 12.2%. So, there is a 68% probability that Apple will be between -12.2% and +12.2% in 60 days, which converts to between $100.97 and $129.03 if Apple’s current price is $115.
The reason you need to use the square root of time is that to calculate the standard deviation, you need to begin with the data’s variance. The variance of any data—such as the price changes of a stock—is based on the square of the difference between the individual data point and the average of those data points. Because there are positive and negative price changes, if you just added them up, the positive and negatives would offset and you wouldn’t get an accurate depiction of how big the price changes were. To determine the variance, the negative values are squared to make them positive, so that when added to the squared positive values, you get closer to an accurate measure of volatility. The standard deviation, i.e. volatility, is the square root of the variance.
The variance is proportional to time. Because you take the square root of the variance to get the standard deviation, the standard deviation is proportional to the square root of time.
Once you have Apple’s volatility, it’s straightforward to calculate the probabilities of it reaching any price at any time, not just one standard deviation in one year. To do that, we treat Apple stock like a standard normal variable, or rather, something whose behavior can be reasonably modeled on a bell curve, aka the normal distribution curve. The bell curve, the bane of high school grading, shows that most of the time the grades—or Apple stock—are clustered around an average level. Some others are a bit higher and lower, and fewer still are much higher and much lower. If you can plop that data—specifically the percentage changes of Apple stock—on the bell curve, you can calculate the probability of Apple reaching a higher or lower price. The math involved isn’t particularly strenuous, but you don’t want to do it by hand. That’s why you can find those probability numbers on certain trading platforms, like tastyworks. They’re calculated for you in real-time, and they’re one of the most important things to know about how to trade.
Here’s what you can’t do: interpret a larger-than-predicted price change as an increase in volatility. For example, if volatility is 30%, and you adjust that down to 1.6% for a one-day, one standard deviation range, what if the stock changes 3.2%, higher or lower? Does that mean that its volatility was actually 60%? No. It means the stock changed two standard deviations. The only way to know whether volatility rose from 30% to 60% is to look at your trading platform.
As we look forward into 2021, we can only hope that the volatility we see is concentrated in the markets and not in the rest of our lives. When we can assign probabilities to our trading and investing, it makes us more confident in taking risks. But when we can’t get a reliable probability of an epidemic or other disaster, all we see is risk. So, if you’re a trader, count yourself lucky. While everyone else is running around screaming, you can calmly bury your head in your trading screen.
The Bell Curve
Bell curves result from graphing a normal distribution of variables. The curves got their name from their symmetrical bell shape.
The highest point on the curve, or the top of the bell, represents the most probable event in a series of data (its mean, mode and median in this case). All other possible occurrences are symmetrically distributed around the mean, creating a downward-sloping curve on each side of the peak. The width of the bell curve is described by its standard deviation.
Financial analysts and investors often use a normal probability distribution when analyzing the returns of a security or of overall market sensitivity. In finance, standard deviations that depict the returns of a security are known as volatility.
Tom Preston, Luckbox contributing editor, is the purveyor of all things probability-based and the poster boy for a standard normal deviate.