Stocks That Rock
Want to make a living from music? Put down the guitar and start picking music-related equities.
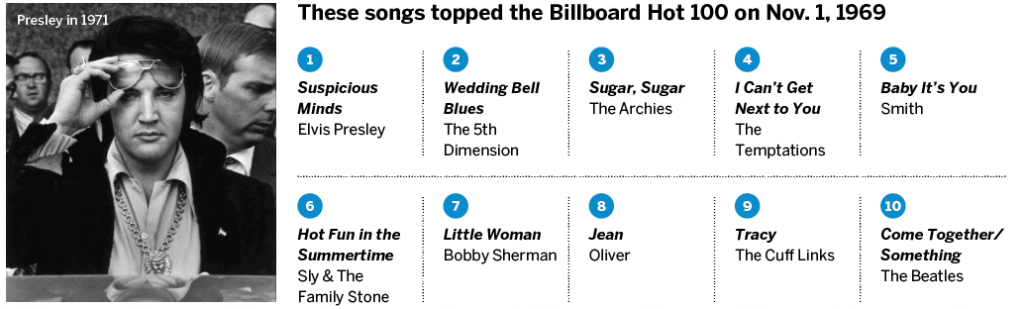
As AC/DC said, it’s a long way to the top if you want to rock and roll. And to measure the top in music, even if it isn’t rock ‘n’ roll, rely on the Billboard Hot 100. The chart, established in 1958, serves as the benchmark of a song’s popularity. Make it there, and you’ve arrived.
Billboard determines its weekly Hot 100 by tracking a song’s sales, streaming activity and radio airplay. Over the years, the methodology has changed—with different ratios of airplay to sales, for example—to try to capture the songs’ true popularity. But it’s not without controversy.
A couple of months ago, 24-year-old rapper 6ix9ine complained that his song Gooba should rank No. 1 instead of occupying third place on the Hot 100 chart behind the Ariana Grande/Justin Bieber collab Stuck With U at No. 1 and Doja Cat feat. Nicki Minaj and their Say So at No. 2. (Full disclosure: 6ix9ine’s Gooba is played about 20 times more often than those other two songs in this trader’s playlist.)
The argument 6ix9ine made for deserving the No. 1 spot centered on discounted streaming numbers and a last-minute possibly engineered spike in sales that allegedly put Gooba at a disadvantage. Billboard defended itself with a thorough explanation of its methodology, and Gooba remained at No. 3.
Hard to chart
Now, Billboard seems as honest as the day is long, and I don’t doubt their sincerity in the Gooba affair or their Hot 100. But look at the Hot 100 for a few weeks, and it becomes apparent how hard it is to crack into it, especially for a smaller act that doesn’t have the marketing muscle of a major label.
For instance, a recent Billboard Hot 100 had only six new songs that week, and not one was in the Top 25. Most were in the fourth quartile. (That’s 75 to 100 for philosophy majors). On top of that, the songs in the Top 10 had been on the Hot 100 for an average of 20 weeks, with all of them in the first quartile between 1 and 25. That low turnover in the list of America’s favorite songs indicates how hard it is to make the list, let alone make it to the top and reap the accompanying publicity.
Maybe some outside influence tries to game the Hot 100. Music is generational to a large degree, and most of the Hot 100 songs are popular with the sub-25 crowd. Acts that aren’t familiar to older listeners don’t generate a large enough audience to chart, regardless of how good their music is. So, any outside influence is likely to help determine the position within the Hot 100, not get an unknown act onto the list.
That relative directionless activity and the lack of surprises in the Hot 100 (except for 6ix9ine) may remind traders of the nature of stock and index prices. Yes, big price changes occur once in a while, but more often than not the S&P 500, for example, trades in a narrow range with a slow upward drift.
And just like the Hot 100, the list of companies in the S&P 500 rarely changes. That first point is why, over time, short option strategies like short strangles, iron condors and verticals tend to make money. They take advantage of a stock or index moving around a lot less than the market thinks it might.
Music stocks
Most dreams of musical stardom are crushed in a middle school band, so it’s more likely to find success in trading options. Let’s combine the two passions and look at some stocks with exposure to the music business.
Apple (AAPL) and Google (GOOGL), via YouTube, are the two biggest companies that have streaming music services, but other stocks have more pure exposure.
Three companies—Sirius XM (SIRI), Spotify (SPOT) and iHeartRadio (IHRT)—are in the business of streaming music and news. Spotify has been the heavyweight of the three, but Sirius bought the music streaming service Pandora two years ago and began to edge into Spotify’s market.
That hasn’t stopped Spotify from dramatically outperforming Sirius and iHeartRadio over the past few months, which has helped give Spotify a market cap two times bigger than Sirius XM’s and 100 times bigger than iHeartRadio’s.
From a trading standpoint, Spotify’s options are more attractive for two reasons. First, its $260 stock price creates larger options prices and more strike prices than Sirius XM at $6 and iHeartRadio at $7. The linear relationship between a stock’s price and its options price means the price of a 90 strike put on a $100 stock will be 10 times the price of a nine strike put on a $10 stock, with days to expiration and implied volatility the same. Second, Spotify’s options are more actively traded and are more liquid.
Comparing Sirius XM to Spotify, Sirius’s $6 stock price means its five and seven strikes are 16.6% away, which makes them far OTM (out of the money). That’s why the short 5/7 strangle with 45 days to expiration generates only $.10 of credit.
Spotify’s strikes are 10 points apart, which is only about 3.5% of its price. That creates options much closer to the stock price that have much higher prices. For example, the short 250/260 strangle with 45 days to expiration generates $37 of credit.
That higher credit is also due to Spotify’s higher implied volatility, which has a greater impact on its bigger options prices than it would on Sirius XM’s lower options prices. That’s why Spotify’s options give traders more to work with.
To take advantage of Spotify’s options, traders could choose a short put vertical if they were bullish or a short call vertical if they were bearish. For a bullish trade, the short 230/240 put vertical with 45 days to expiration collects a $3 credit and has a 70% probability of profit at expiration. For a bearish trade, the short 280/290 call vertical with 45 days to expiration also collects a $3 credit and has a 70% probability of profit at expiration.
To calculate the probability that a short vertical will make at least $.01 of profit at expiration, take its max loss and divide it by the width of the strikes. For both the short put vertical and short call vertical, the credits were $3 and the width of the strikes is $10. Their max loss is $10 – $3, or $7. Divide $7 by $10 to get a 70% probability of profit.
These trades aren’t guaranteed to make money, but their probability of success is higher than the chances of a garage band making it to the Hot 100. Do those kids a favor and give them a copy of Luckbox.
Tom Preston, Luckbox contributing editor, is the purveyor of all things probability-based and the poster boy for a standard normal deviate.