Watch These 3 Inflation Indicators
I remember seeing the “WIN” buttons when I was a kid and having my parents explain inflation to me. The buttons, distributed at the behest of President Gerald Ford in 1974, stood for “whip inflation now.” Inflation was bad and whipping it was good.
I also asked them what “burn the bra” meant, but they were more reticent about that one.
But having a basic idea of what inflation was and what it does to prices helped me understand how the economy works. As time passed, I noticed when inflation was high or low. And since the early ’70s, inflation really hasn’t been an issue in the U.S. until now.
A return to ’70s inflation?
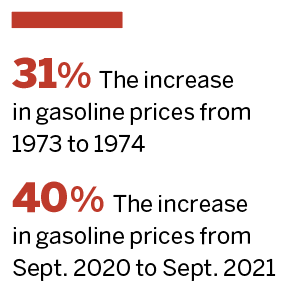
From 1973 to 1974, when “WIN” buttons proliferated and politicians campaigned on inflation fears, the average price of a gallon of gasoline rose about 31%. Inflation helped force Richard Nixon from office, and it pushed the Fed to raise the federal funds rate from 6% in January 1973 to 11% the following August.
How does that compare with today? From September 2020 to September 2021, the price of a gallon of gas rose 40%. Prices for other consumer products have risen, too, but gasoline is a convenient metric, and it’s arguably one of the most psychologically important prices.
So, with gas prices up and the public feeling the pinch of higher rent and higher prices in general, inflation has become a political talking point. The question is whether inflation will pose a long-term problem the way it did in the ‘70s. Will the country suffer through stagflation and a bear market in stocks, or adjust quickly and ramp up the economy? The right thinks inflation will be around for a while and blames the Democrats. The left thinks it’s just temporary and blames the Republicans for stoking inflation fear.
Economists don’t know because today’s government policies, political issues, money supply, debt—and even psychology—differ from conditions during past bouts of inflation. The past doesn’t have much predictive value. So, let’s turn to the collective genius of the markets.
Rising interest rates
The markets show us that expectations of inflation drive up interest rates. As inflation goes up, interest rates tend to go up, too. The rationale is that having too much currency in the hands of consumers is one of the causes of inflation. To reduce it, the Fed increases the interest rate to make buying T-bills, CDs, notes and bonds more attractive.
When consumers buy bonds instead of products, the Fed takes in the money and doesn’t spend it. The amount of currency in the wild is then reduced. And with less currency for consumers to spend on goods and services, prices should fall, which should reduce inflation.
Three factors indicate the market thinks interest rates are going higher, which could bring higher inflation in the future, or lower, which could indicate lower inflation. And right now, they’re pointing toward higher inflation.
Three signs of inflation
The first factor to watch is the breakeven inflation rate, which is the yield of a Treasury note, say the 10-year yield, minus the yield on an inflation-indexed note of the same maturity. The difference in the yields is the market’s expectation of future inflation, and as of the time of this writing, that spread is the highest it’s been in 10 years.
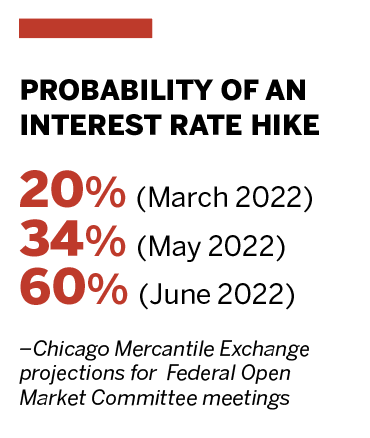
Second, look at the Fed Funds rates to see the probability of a rate hike at upcoming Federal Open Market Committee meetings. According to the Chicago Mercantile Exchange (CME), the probability of a rate hike at the March 2022 meeting is 20%, but by the May 2022 meeting it rises to 34%, and by the June 2022 meeting there’s a 60% probability of a rate hike. Those odds point to the Fed raising rates, maybe in response to inflation.
Third, remembering that when rates go up bond prices go down, look at the prices of options in the 10-year Treasury note (/ZN) to compare the probabilities of it dropping (rates going up) or rising (rates going down). The trick is to convert the price change of /ZN to a change in yield. To do that, one needs to know the dollar value of a basis point, known as DV01. The easiest place to find that is on the CME’s Treasury Analytics page. For /ZN, DV01 is $79. That means if the yield on the 10-year Treasury note rises .01% (e.g., from 1.54% to 1.55%), the total value of the /ZN future, which is its price times $1,000, would drop $79.
If the price of /ZN is 130, its value is $130,000. A 25 basis point, or .25% increase in yield, would move /ZN down 2.00 to 128, and a .25% decrease would move it up to 132. Looking at the 128 put and 132 call in the January 2022 expiration, the probability of /ZN being below 128 is 26%, and the probability of /ZN being above 132 is 21%. That means the options markets say a .25% increase is more likely than a .25% decrease.
With three indicators suggesting the market sees higher rates and inflation, readers may want to stock up on gasoline.
Tom Preston, Luckbox contributing editor, is the purveyor of all things probability-based and the poster boy for a standard normal deviate. @fittypercent