2021 Portends Some Trends to End
The markets—and the Federal Reserve’s efforts to move them—have been in persistently unprecedented territory for more than a dozen years. Looking forward to the new year, there’s no doubt the Fed will keep its hand in the financial markets.
So, let’s divine the likely direction of some major asset classes. The nine charts that follow suggest 2021 will be a bad year for equities yet a good one for gold and bonds. Let’s examine some classes one by one.
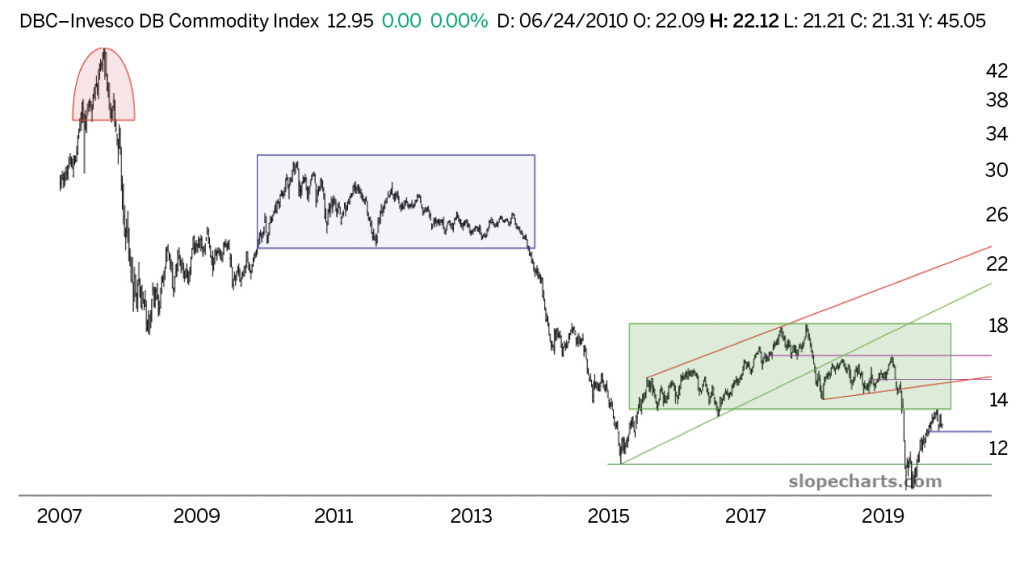
Commodities (DBC)
This chart goes back more than a dozen years, and it features three major reversal patterns, the most recent of which is the largest. At first, it may seem that commodities have little to do with equities, but the profoundly bearish setup of this chart feeds into the notion that a large equity bear market is forthcoming because weaker commodities are a byproduct of a weaker economy. In turn, a weak economy—whose effects have doubtlessly been countered by the Fed’s trillions of dollars of fresh fiat in 2020—will eventually express itself in the form of shrinking equity prices.
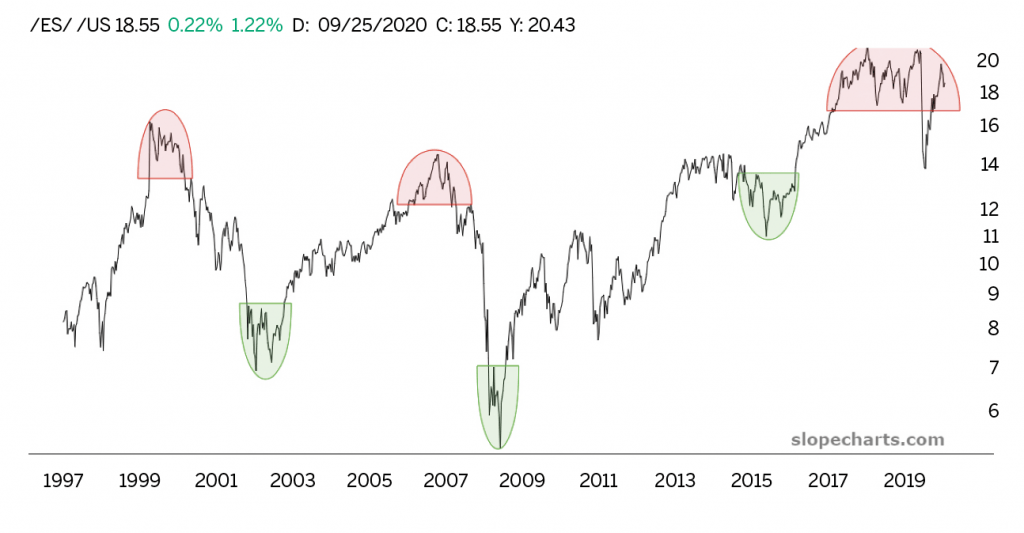
Equity/Bonds Ratio
Combining the anticipated movement of equities (down) with bonds (up), a relatively regular cycle is revealed by way of a predictable relationship between S&P 500 futures and U.S. Treasury bonds. The chart possesses an equal number of topping and bottoming patterns, the most recent a topping pattern. Note that this particular reversal pattern is larger than any of the five that preceded it.
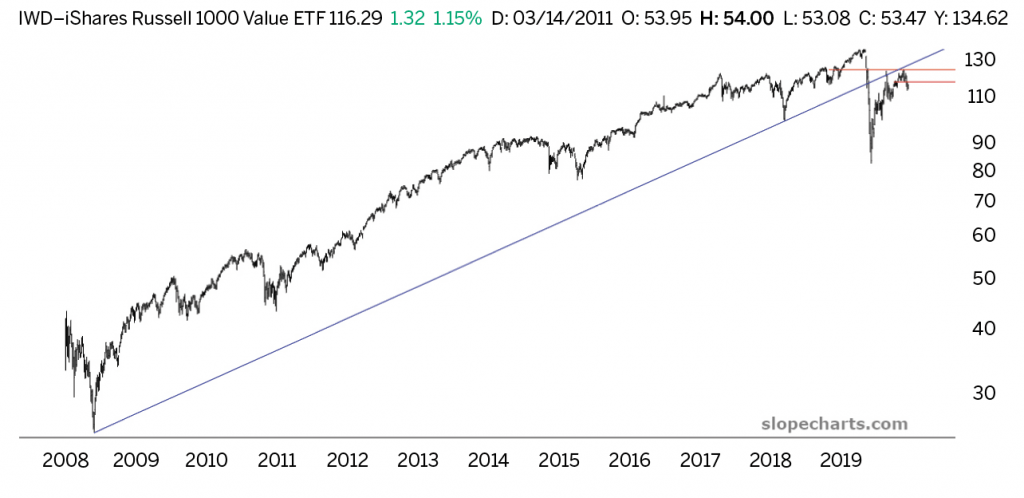
Russell 1000 Value (IWD)
Until the pandemic struck, this chart wasn’t particularly interesting because it simply followed a smooth course upward for a dozen years. However, what transpired from February through September of 2020 utterly altered the meaning of the chart because of two large changes:
- The long-term ascending trendline was irrevocably shattered.
2. Even after massive Fed intervention, the only thing the price action accomplished was illustrating that what had once been support had now turned into formidable resistance. In other words, the role of the trendline itself had changed.
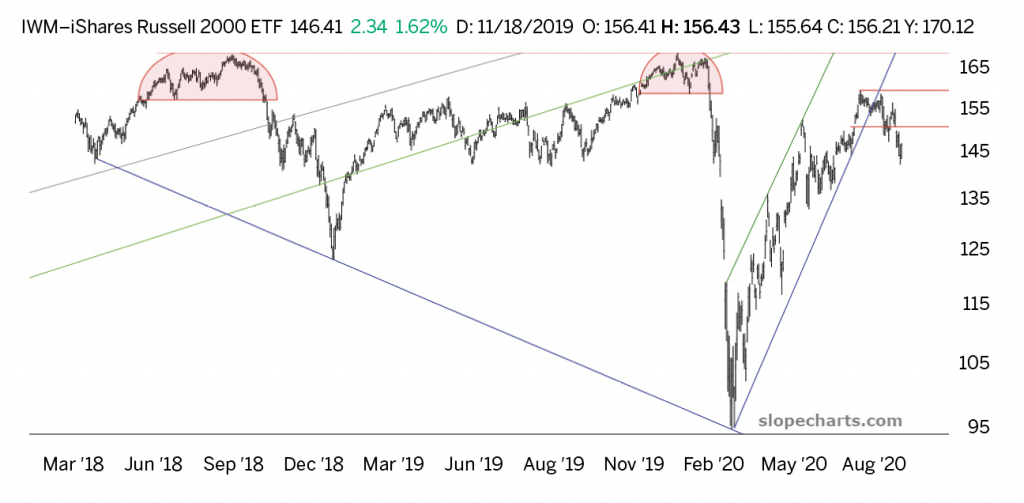
Russell 2000 Small Caps (IWM)
The exchange-traded fund based on a broader Russell index, the “small caps” IWM, is shown here with a deliberately smaller amount of data: about three years instead of a dozen. Note a couple of remarkable properties of this chart. First, three distinct reversals took place. The first occurred before the Q4 2018 sell-off, the second came in late 2019 and early 2020 before the pandemic, and the third took place late in the summer of 2020. The first two reversals were followed by significant falls, and the third seems to exhibit similar tendencies. The second thing to note is that a clean channel managed to contain the price action following the March 23, 2020 bottom until the downside breakout, commencing the creation of the third reversal pattern.
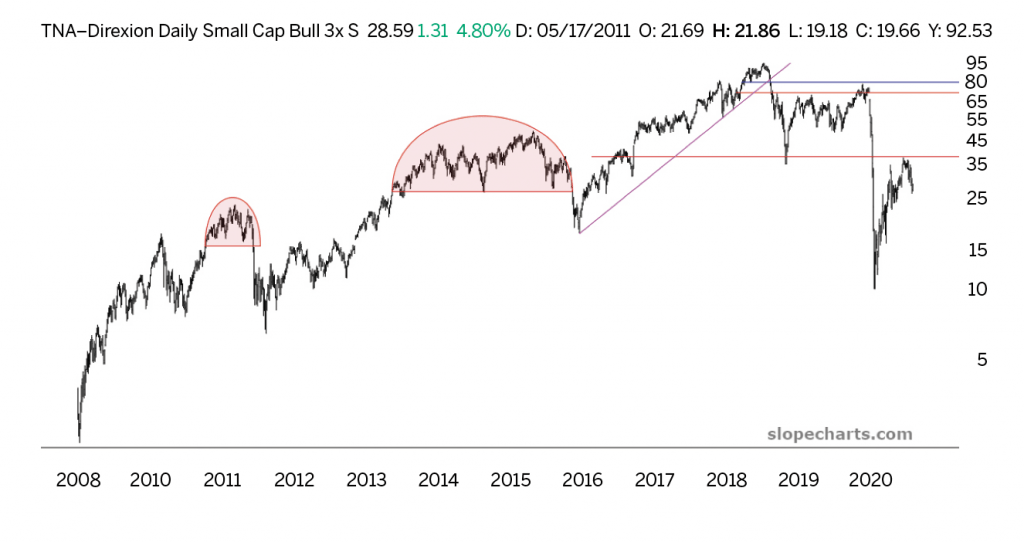
Triple-Bullish Small Caps (TNA)
Normally, it can be misleading to look at any leveraged fund to gain insights into the market. Even some non-leveraged funds are deceptive about the markets they represent, simply because they are imperfectly constructed. For example, it would be unwise to use the United States Oil Fund LP (USO) as a proxy for the long-term trends of the crude oil market, even though the fund is based on crude oil. Over the course of time, however, the chart of the fund looks vastly different from a continuous contract chart of the crude oil market, even though the general uptrends and downtrends match.
This is usually even more exaggerated with leveraged funds, but sometimes these funds provide helpful long-term insights. The Direxion Daily Small Cap Bull 3X (TNA), for example, is a triple-bullish fund based on the Russell 2000 small caps. The chart goes back a dozen years and sports three large reversal patterns, each one larger than its predecessor. As highlighted from 2016 to present, the latest reversal setup is nothing short of gargantuan and strongly suggests lower equity prices ahead.
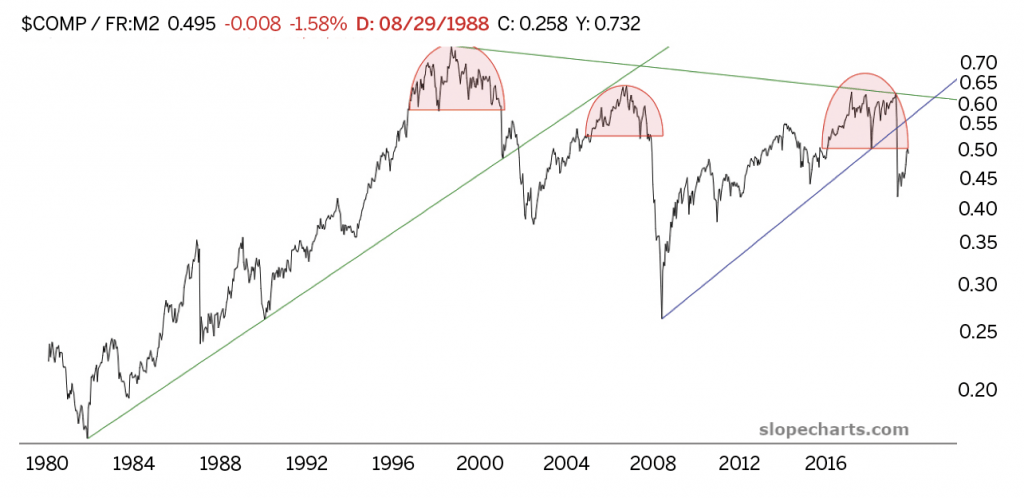
Dow Composite/M2 Ratio
As noted in a previous Technician column, “A ratio chart is created by dividing the values of one chart by the values of another chart. The simplest way of plotting a ratio chart is by using the closing prices of the respective financial instruments—a chart of Apple (AAPL) divided by Alphabet (GOOGL), gold divided by crude oil, the U.S. dollar divided by wheat, or anything else one might imagine.”
In this instance, divide the Dow 65 Composite by the U.S. money supply measurement known as M2.
In spite of the equity index being altered by a data set that has nothing do with stocks, the resulting graph is extraordinary. The three reversal patterns are even cleaner than on a normal, unaltered chart, and the behavior of the trendlines is exactly what one would hope to see: a crystal-clear example of how support has morphed into resistance.
In this case, the trendline dating back to the major 2008/2009 bear market bottom was broken by the pandemic, and the multi-trillion-dollar bailout from the Fed merely served to push prices back to precisely the underside of the now-broken trendline.
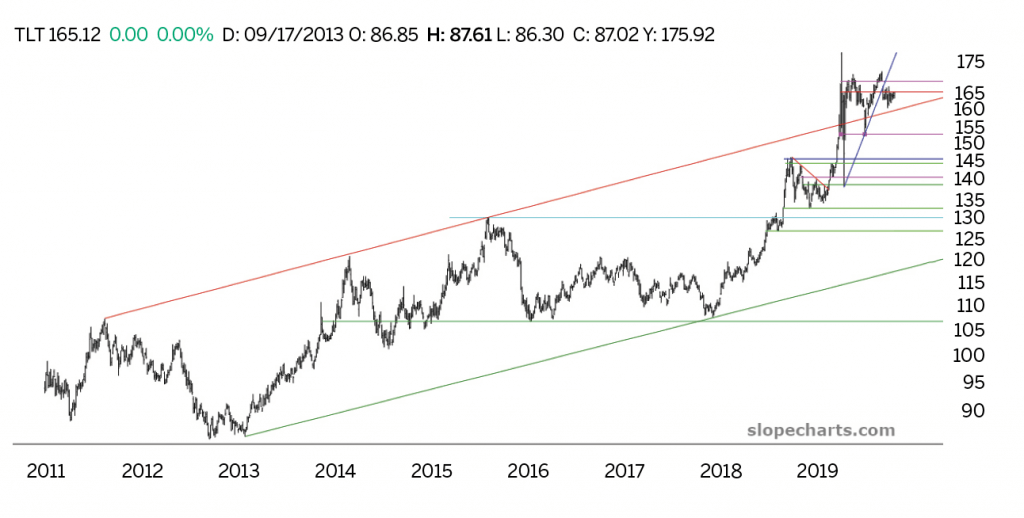
U.S. Treasury Bonds (TLT)
The world has never been deeper in debt. There are literally hundreds of trillions of dollars of public, private and unfunded liabilities, so it has never been more important—for the sake of debtors—that interest rates remain low.
Based on long-term trends, this seems likely to remain the case. The chart of iShares 20 Plus Year Treasury Bond Exchange-Traded Fund (TLT) is on the cusp of what could be another important breakout. Should that transpire, it will be because the market is affirming that lenders are still willing to loan money at historically low rates and that rates are likely to remain low for a long time.
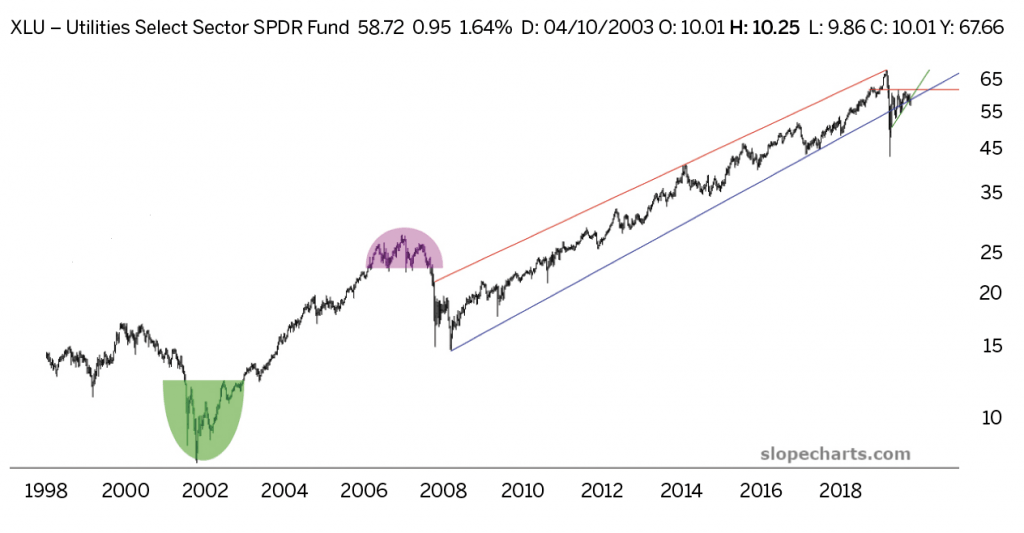
Dow Utilities (XLU)
In a market rife with biotech companies, semiconductor manufacturers, electric car companies and virtual conferencing corporations, a collection of stocks as humdrum as the Dow 15 Utilities might put traders to sleep. But that’s an error because the price action of utility stocks, particularly when rolled up into the index itself, can provide great insights and trading opportunities.
This chart of the Utilities Select Sector SPDR Fund (XLU), which is based on the SPDR MSCI Europe Utilities UCITS Exchange-Traded Fund (UTIL), spans three decades and has three principal features. The first, an inverted head and shoulders pattern following the internet bubble, presaged an enormous bull run-up. The second, an extraordinarily clean head and shoulders pattern, preceded the financial crisis. The third, and largest, is the price channel spanning a dozen years which, importantly, was shattered to the downside in 2020. This is yet another piece of evidence that the direction of equities has made a fundamentally important turn.
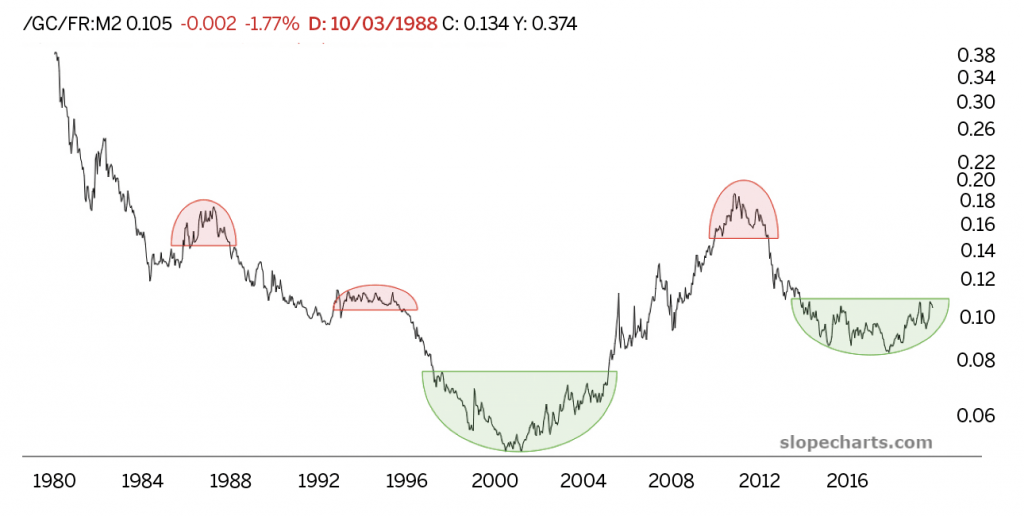
Gold/M2 Ratio
The gold market is looking positive on a long-term basis. Whereas the Dow Composite divided by M2 looked decidedly bearish, the gold market divided by M2 looks particularly bullish. The projection has more credence because the long-term chart is a mix of both bullish and bearish patterns, and the most recent bullish base is an exceptionally clean saucer pattern, a classic in technical analysis.
Changing tides
The factors that influence the markets change on a daily basis. Visit slopeofhope.com for updated versions of these charts and to peruse the commentary of fellow traders, each with a different take on what promises to unfold as a terribly exciting 2021.
Tim Knight has been using technical analysis to trade the markets for 30 years. He hosts Trading the Close daily on the tastytrade network and offers free access to his charting platform at slopecharts.com.