Bitcoin Bets & Game Theory
The best investors and gamblers have something in common. They share an emphasis on game theory—a rational way to quantify the expected gains from decisions and probabilities.
While generally applied to economic decisions, game theory can also help gamblers identify optimal moves in games like poker that involve a series of decisions.
But most investment analysis relates to intrinsic value, macroeconomic trends, and trading and hedging strategies. Billionaire investor Paul Tudor Jones, for example, wants to allocate 5% of his portfolio to bitcoin to protect against inflation while he’s strategizing to take advantage of the occasional booms.
Many mainstream investors choose exchange-traded funds, or ETFs, to provide access to new financial technology. Active traders, on the other hand, may want to play in a volatile asset class.
So, what happens when they set aside those considerations in favor of game theory? Instead of looking at the merits of bitcoin as an asset, they would consider the potential outcomes of a decision to buy it or not.
Past as prologue?
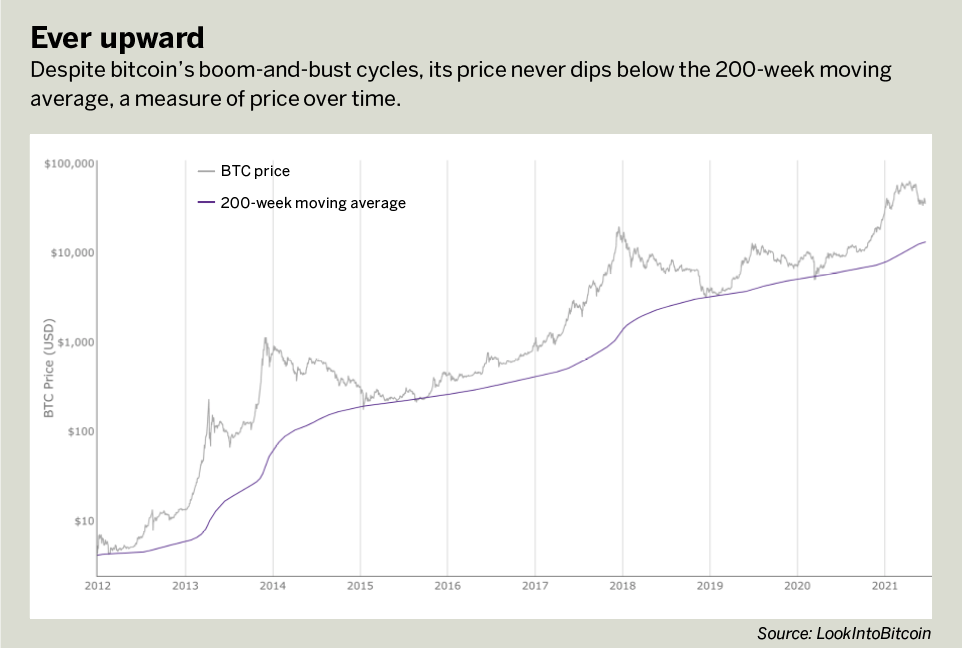
Investors need only to glance at the chart entitled Ever upward, below, to spot an obvious trend: Bitcoin goes up in value.
Not just up, but way up—from $0.003 to $30,000 over 12 and a half years, and $400 to $30,000 over the last five years.
The Ever upward chartalso indicates bitcoin’s upswings of more than 1,000% and crashes of greater than 80%. (The chart doesn’t show the fake trading, criminal activity, bans, scams, manipulation, speculation and all sorts of other shenanigans that have marred bitcoin’s history. But we’re not looking at that. We’re considering only the investment case.)
Bottoms go up, too
It’s also worth noting that during bitcoin’s boom-and-bust cycles, its price never dips below the 200-week moving average, a measure of price over time. That line always goes up, as shown in Ever upward.
Coincidentally, that moving average correlates with on-chain data and trading patterns that mark every major market bottom.
As long as those patterns continue, the 200-week moving average should serve as the floor for bitcoin’s price. At the same time, savvy players can use that line as a stop-loss. Once the price goes below, the trend breaks and signals an opportunity to get out before the inevitable fall to zero.
Choices and consequences
Bitcoin is a speculative investment that has averaged 200% returns year-over-year. So far, its price never stays below its 200-week moving average and always goes higher over time.
For investors considering whether to put, say, $300 into bitcoin as a long-term portfolio asset, here are the most likely outcomes:
Outcome 1: Bitcoin’s price drops below the 200-week moving average ($13,000 today). Result: lose $170.
Outcome 2: Bitcoin behaves like other commodities—sometimes up, sometimes down. Result: break even with opportunities to take profits once in a while.
Outcome 3: Bitcoin’s price continues to go up 200% each year, on average, and sometimes up 1,000% or more. Result: $600 on average each year, with an occasional massive windfall.
Outcomes 1 and 2 have never happened. Outcome 3 has always happened. So which appears most likely?
It’s impossible to say. Nobody can predict the future. Sometimes patterns stop. But from a gambler’s perspective, it’s not the worst bet. Far from it.
Does that mean bitcoin will continue to grow? For those who believe it will, buying is mandatory.
For those who don’t believe it will, what other long-term passive investment offers better risk-adjusted outcomes?
Mark Helfman, crypto analyst at Hacker Noon, edits and publishes the Crypto Is Easy newsletter at cryptoiseasy.substack.com. His second book, Bitcoin or Bust: Wall Street’s Entry Into Cryptocurrency, reached No. 2 on Amazon. @mkhelfman