Britain’s Cautionary Tale
Investors and analysts usually go back 10, 20 or 30 years when they consider long-term economic data. But how about taking a really long view? Let’s fire up the time machine and travel back to the middle of the 19th century. And to keep it really interesting, let’s look at the undisputed No. 1 economic power in those days: the United Kingdom.
Less time on the job
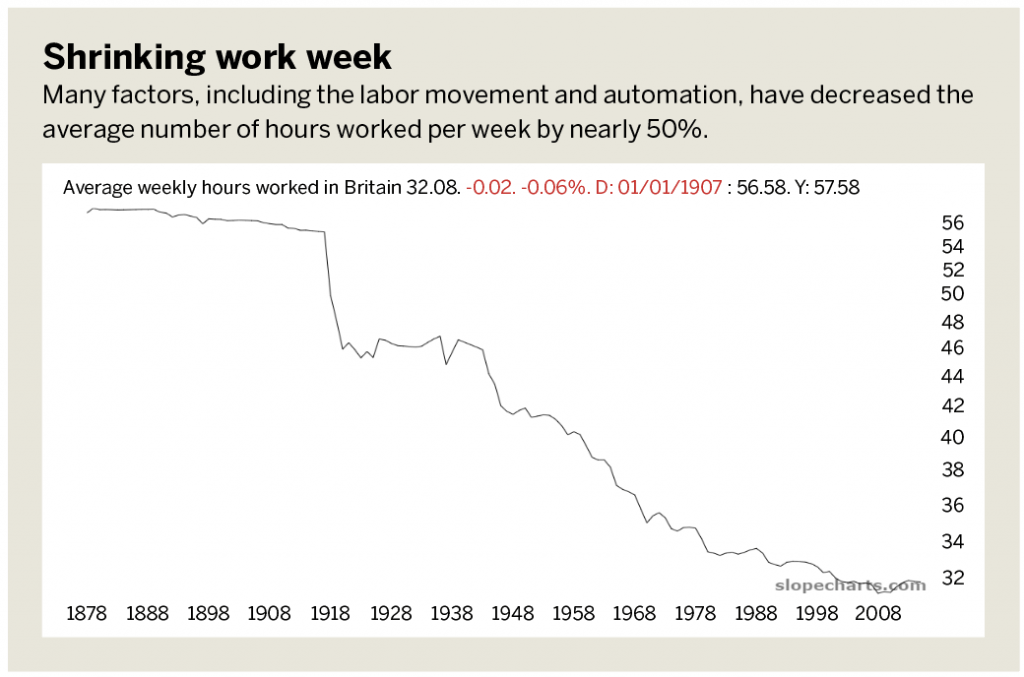
It’s fascinating to consider just how radically the length of the work week has changed. At the beginning of the time series, around 150 years ago, workers toiled for an average of about 60 hours a week. That required reporting to the job six days a week and staying there 10 hours a day. And each of those hours was probably grueling.
Contrast that with the present. A host of factors, including the labor movement and automation, have combined to reduce the average number of hours worked per week by nearly 50%. Oddly, the bigger decreases took place around the time of the two World Wars, illustrating the improved bargaining power that men returning from battle had with their employers.
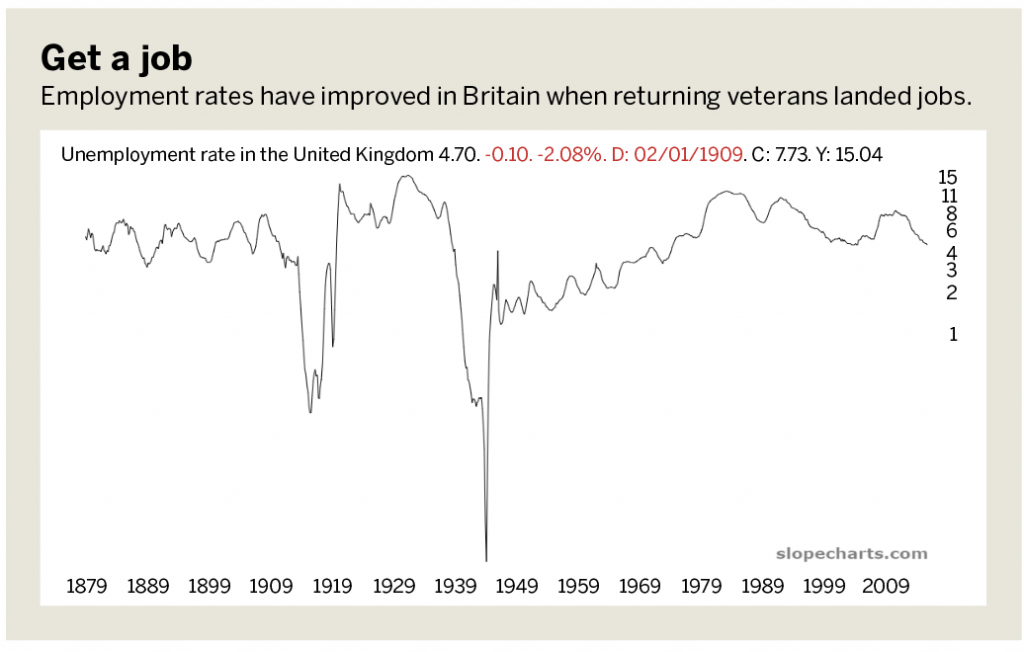
The British unemployment rate over the years is startling. In spite of the miserable working conditions of the 1870s, employers seem to have found all the workers they needed. The unemployment rate was persistently around 6% to 7%. What managed to push it beneath 1% was The Great War (now known as World War I). But worldwide depression soon followed, and unemployment ascended to about 15%.
Then global conflict came to the “rescue” again when World War II broke out. This time, the unemployment rate effectively went to 0% because every breathing person was either fighting in the war or producing materiel for it. Following yet another victory, however, Britain once again saw unemployment climb from the 1950s through the 1970s. With economic malaise and stagnation, the rate began to challenge the peak of the 1930s. In more recent days, the job market had regained its strength—at least until the pandemic.
Goods and services
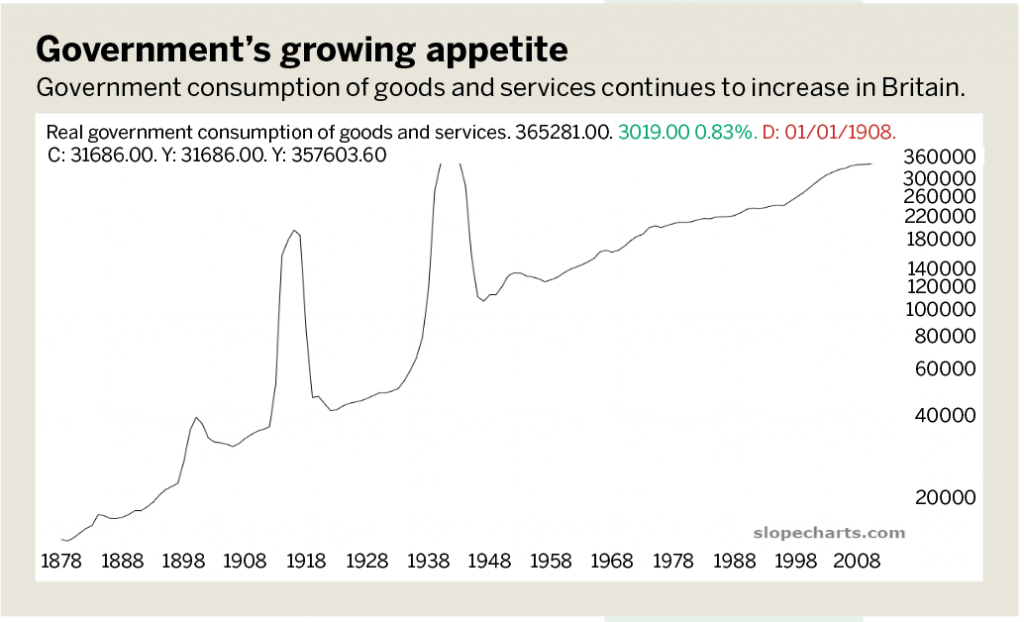
Perhaps the greatest sea change in economies around the world has been the role that national governments have assumed. Driven partly by enthusiasm over Keynesian economics, most large nations have made government their largest customer (and nearly their largest employer).
Britain was no exception. Take a look at government consumption of goods and services. As with all the graphs here, this one is on a logarithmic scale because the sheer increase in growth would make the chart look absurd on an arithmetic scale. The overall trend is clearly ascending, and three “bumps” (of increasing magnitude) were caused by major conflicts: the Boer War, World War I and World War II.
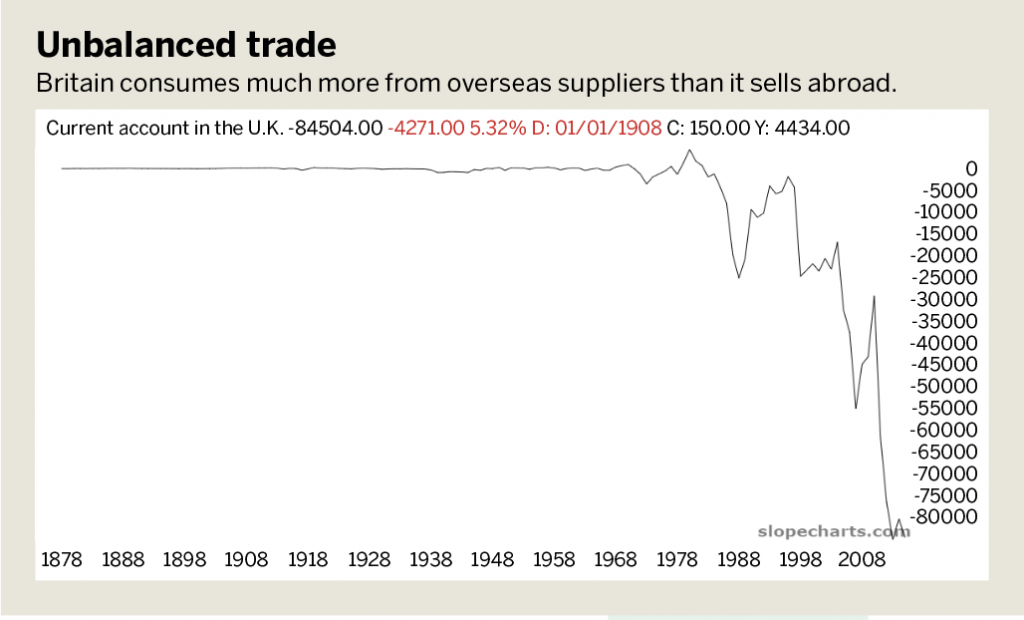
Although the British government was altogether generous in its acquisition of the goods and services of its own people, the same cannot be said for how the other nations interacted with Britain. Although the 19th century was the apex of British power and importance in the world economy, the chart of its current account—the net balance between imports and exports—plainly shows how Britain consumes vastly more from overseas suppliers than it sells to other countries.
Unprecedented rates
What’s the result of “megatrends” like the gargantuan role of government in the economy, crumbling exports and, until recently, a strong labor market? It’s caused the wholesale collapse of interest rates over the past 40 years.
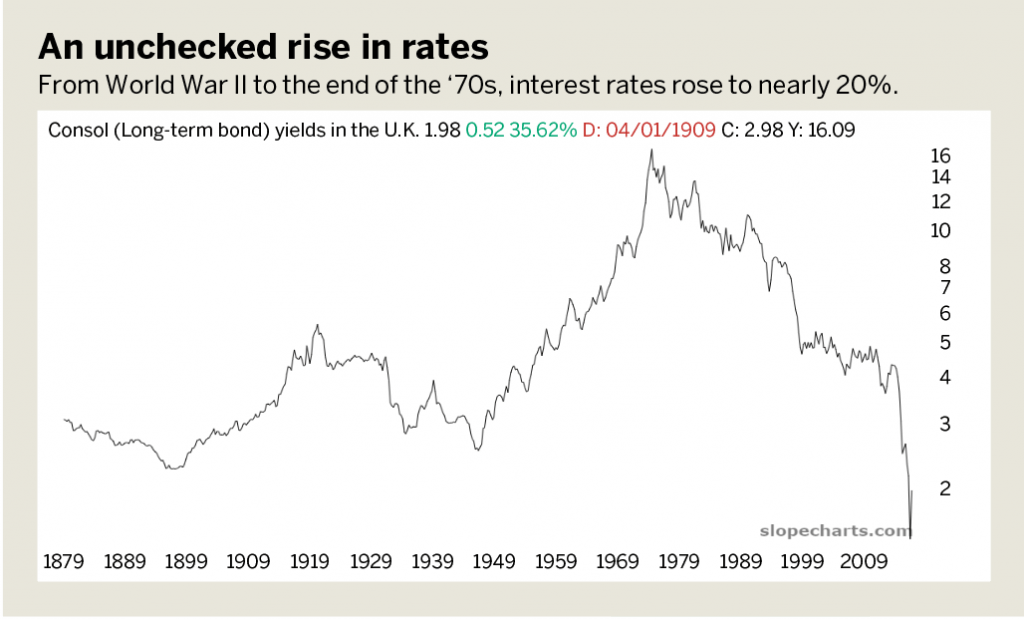
From World War II to the end of the 1970s, rates rose from about 3% to nearly 20%. That had a suffocating effect on the economy, as the malaise of the 1970s demonstrated in Britain. Since then, however, rates have slid downward, as they did in the U.S. and Japan.
The “Policy Rate,” the equivalent of the Discount Window of the U.S. Fed, is set by England’s central bank for overnight lending to member banks. Although this rate had been sliding for decades, the COVID-19 response has effectively placed it at zero, which even over the span of a century is unprecedented.
Plunging pound
Like most major currencies, the supply of British pounds has grown exponentially over the decade, but what’s especially shocking is the rate of its recent ascent.
From the 1870s to just before World War I, the gold-backed currency remained stable, and the money supply grew slowly and steadily. The advent of war, however, swiftly pushed the “M0” higher, and it plateaued at approximately that level until World War II, when it grew again.
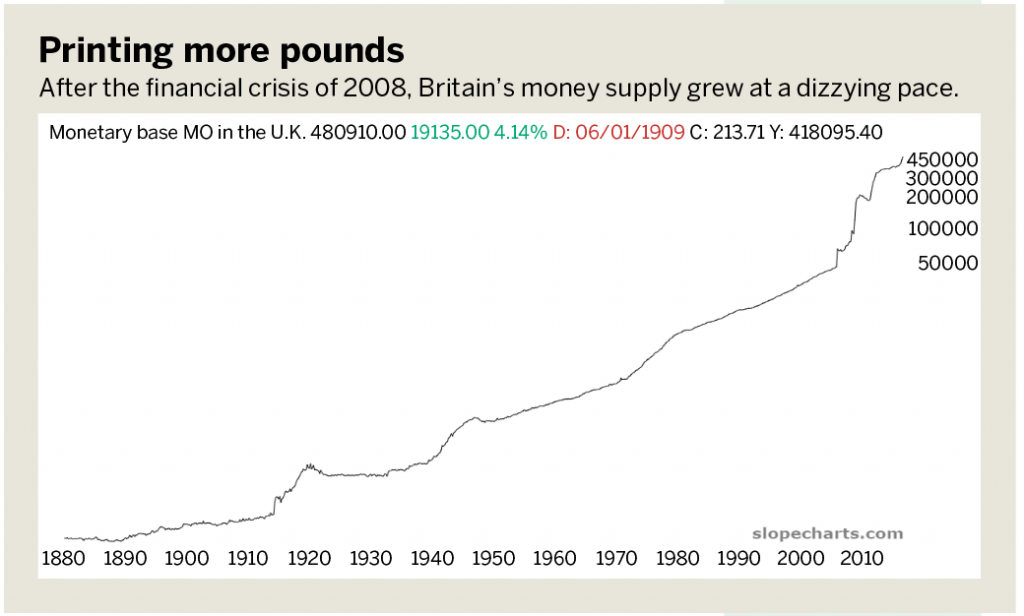
From that point, roughly three phases of fiat hypergrowth occurred. From around 1945 through 1970, the money supply grew at a faster pace, but quite steadily. From the 1970s until 2008, the pace remained steady, but the angle of the ascent was slightly sharper. Following the financial crisis of 2008, however, the money supply went absolutely bananas. In short, the past dozen years have no precursor, even the explosion of money during two global conflicts.
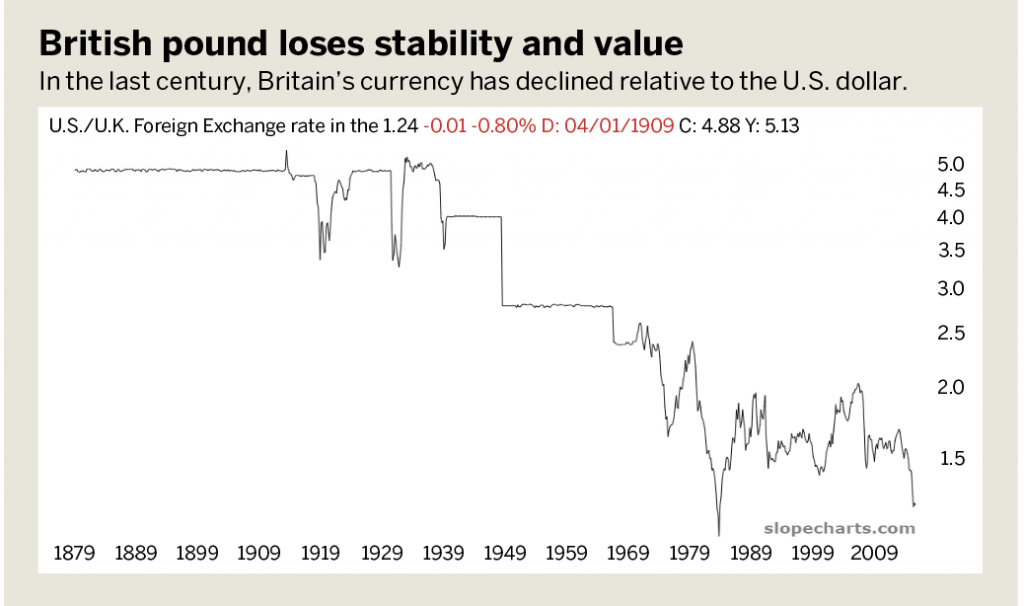
Growth comes at a price, as illustrated by the chart of the British pound’s value relative to the U.S. dollar, an instrument that hasn’t been backed by gold since 1933 or silver since 1968. In the 19th century, and for the first decade of the 20th, the British pound was astonishingly stable—almost a flat line on a graph. Through the aforementioned later turmoil, however, it’s been debased to about one-fifth of its previous value.
Britain has been one of the great financial centers of the world with much of the business conducted in the City of London, the richly historic home of the stock exchange and the Bank of England. But the fall from grace of the former British Empire on the world economic stage has been a sight to behold.
What’s more, central bank “accommodation” has spread far beyond the shores of the United Kingdom. In the United States, the stunning 10,000 point increase in the Dow Jones Industrial Average that took place in just 11 weeks following March 23 provides living proof that multi-trillion-dollar fiat creation can swiftly re-inflate assets, even when they have endured an unprecedented collapse in both value and confidence.
During times like these, it’s valuable to take a long look backward at trends that endure longer than a human lifetime and see the devaluation that can take place in a nation’s currency and core economy.
Tim Knight has been using technical analysis to trade the markets for 30 years. He hosts Trading the Close daily on the tastytrade network and offers free access to his charting platform at slopecharts.com.