Less Than Zero

All of the attention in markets was focused on crude oil the week of April 20, when on that Monday and Tuesday, the price of West Texas Intermediate (WTI) crude oil fell to a new all-time low, below zero, and to negative $40.32 per barrel in the expiring May futures contract. Any trader who had believed the risk of a long position on the downside in oil was zero learned a painful lesson.
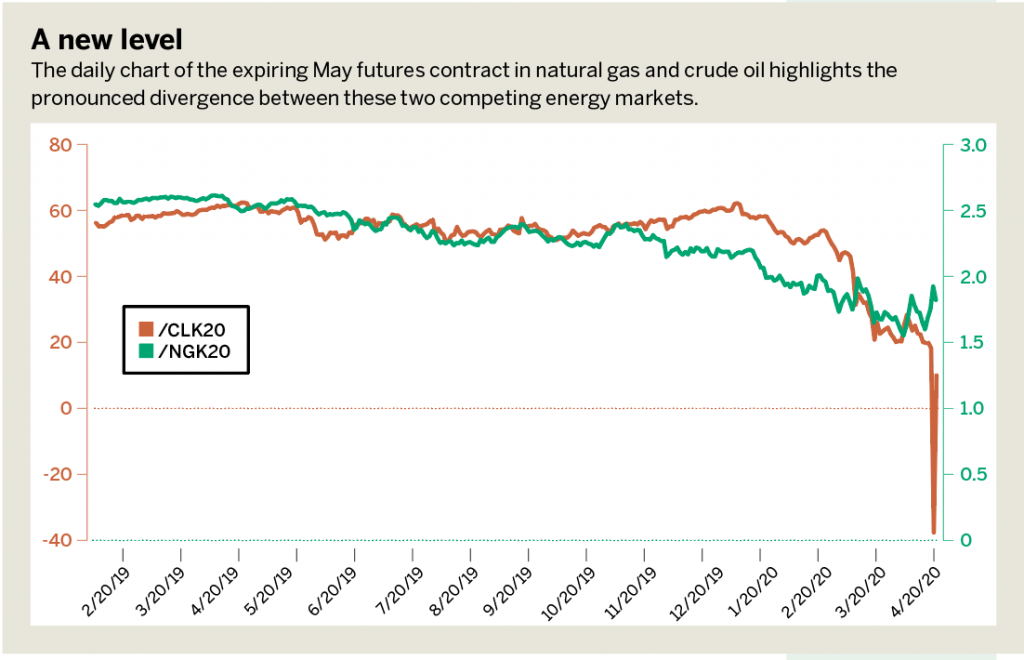
Meanwhile, another energy commodity that tends to be even more volatile than the oil market turned in a different performance. While natural gas and crude oil moved in opposite directions at the beginning of the previous week, the oil market taught natural gas market participants a number of critical lessons that traders should not ignore. (See “A new level,” below.)
Natural gas tends to make lows at the end of the peak season and rally in the spring, which could account for recent price action.
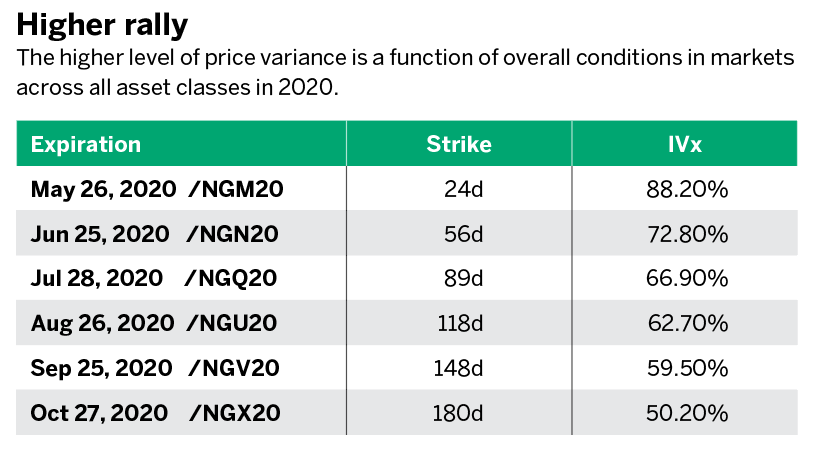
However, monthly implied volatility at the 80% level was appreciably higher than during the past three years in April when it stood at 20%-30%. The higher level of price variance is a function of overall conditions in markets across all asset classes in 2020. (See “Higher rally,” below.)
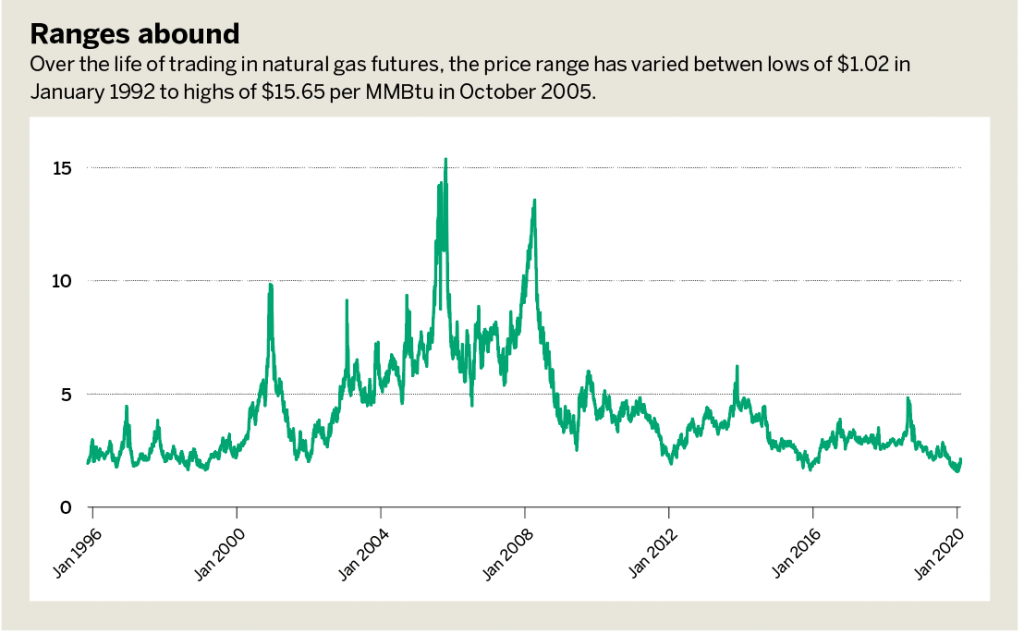
Natural gas has been a wildly volatile commodity since the inception of trading on the NYMEX in 1990. Over the life of trading in natural gas futures, the price range has been lows of $1.02 in January 1992 to highs of $15.65 per MMBtu in October 2005, following the devastating effects of Hurricane Katrina on the Gulf Coast of the United States and the natural gas infrastructure in Louisiana.
While natural gas ignored the action in crude oil the week of April 20, traders should learn a lesson from the oil market. The delivery point for NYMEX oil futures is in Cushing, Okla.
The lack of storage capacity sent the price of crude oil to under negative $40 per barrel as the expiration of the May contract approached. Those with long positions found themselves selling at any price to close risk positions. The delivery point for NYMEX natural gas is in Erath, La., and a similar situation in the future could send the price of natural gas below zero. Crude oil futures had never traded below the $9.75 level before last week.
Oil’s journey into a bearish abyss that week should teach market participants in the natural gas arena at least two lessons when it comes to risk parameters for the energy commodity.
First, the potential loss on a short put option is not limited to a zero price. Put options tend to trade at lower implied volatility levels than equidistant call options as market participants assess the risk of the upside at infinity and the downside at zero. However, oil reminded natural gas market participants that there is no implied put at zero in the market, and the price could fall into negative territory.
The second is that the highly liquid ETF and ETN products could suffer structural issues if the market were to go negative before administrators and issuers make changes to reflect the potential for negative values.
The lesson from oil is that there are additional risks when using products that replicate price action but are not structured to reflect all market conditions.
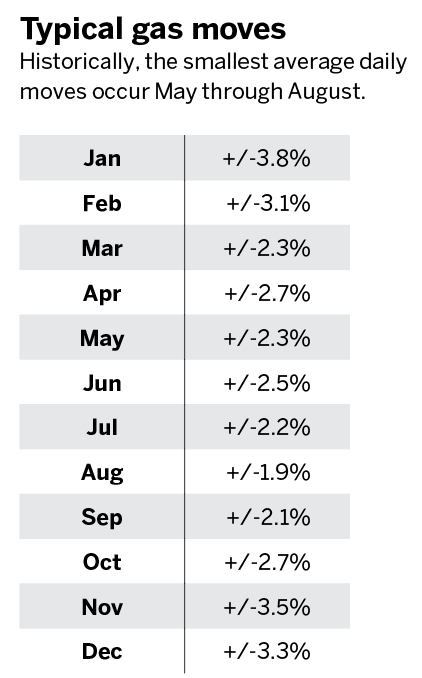
Average summer realized volatility in natural gas is 35%. (See “Ranges abound,” above.) As referenced in “Typical gas moves” (below), some of the smallest average daily moves occur in the months of May through August. With natural gas futures implied volatility at highs and skew nearly flat, selling volatility with strangles or defined risk put or call spreads affords traders attractive opportunities on both sides of this market.
Pete Mulmat, chief futures strategist at tastytrade, serves as host for a number of daily futures segments on the tastytrade network under the main flagship programming slot called Splash Into Futures.