Technical Trading Indicators are Pointing Netflix Lower
The high-flyer could trade below $500 if support fails to hold

Channels and midlines have a fascinating relationship in Netflix (NFLX) stock charts.
A channel consists of a pair of parallel lines that confine price action and help define support and resistance. A midline parallels the lines of the channel and resides precisely in the middle. In rare instances—like the Netflix history—the midline carries every bit as much importance as the two channel lines.
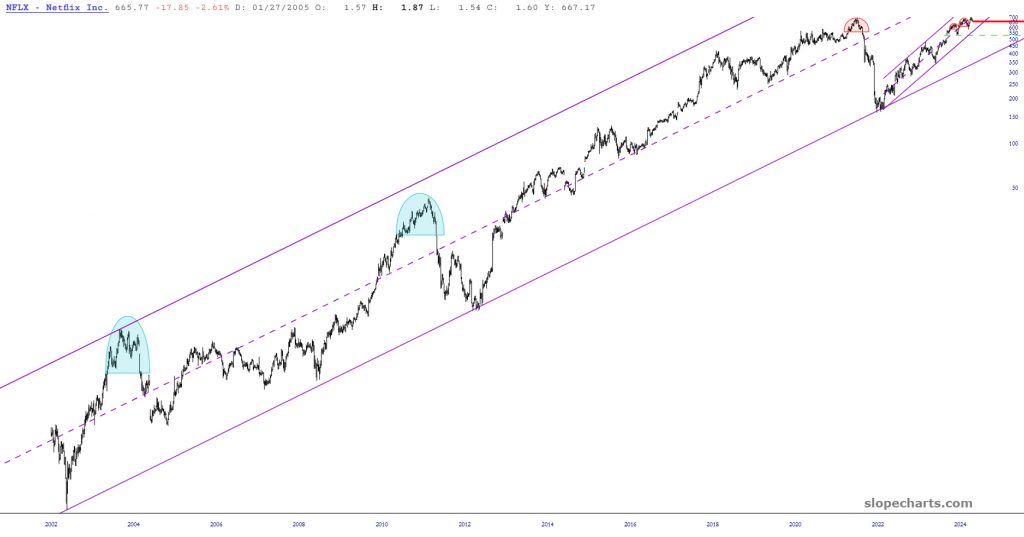
The first chart, a complete history of Netflix as a public company, shows nearly a quarter century of price data is completely contained within the channel. It met major resistance four times this millennium. There have also been four instances in which prices have met major support. The midline plainly serves as its own up barrier. For example, once prices rose above the midline in May 2013, they remained steadfastly above the midline for nearly 10 full years.
Late in January 2022, prices drooped beneath the midline, and they’ve been beneath it ever since.
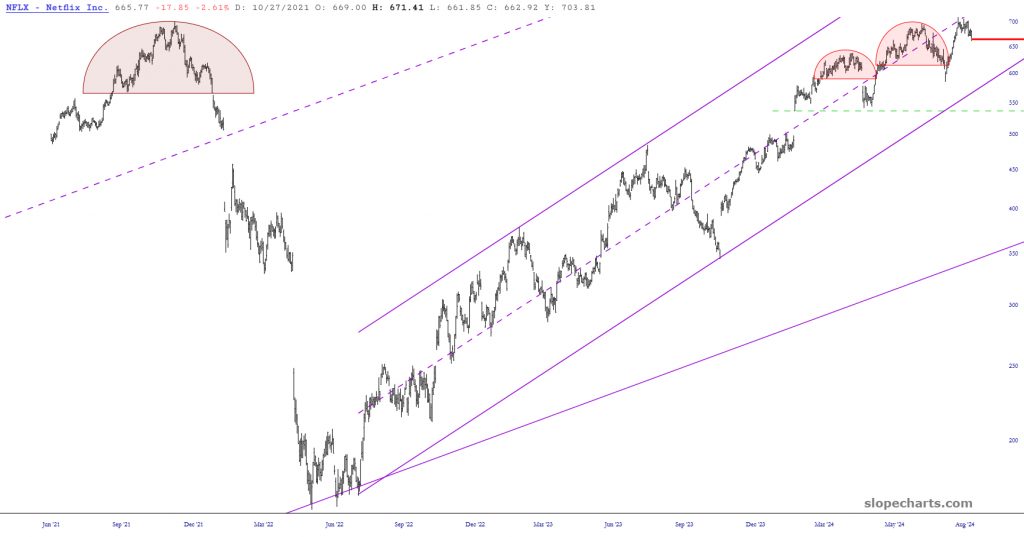
Zooming into more recent history, we see another smaller channel confining prices in a fractal fashion. Here, too, the midline holds quite a bit of sway over prices, which have been confined by this smaller channel for an impressive 26 months.
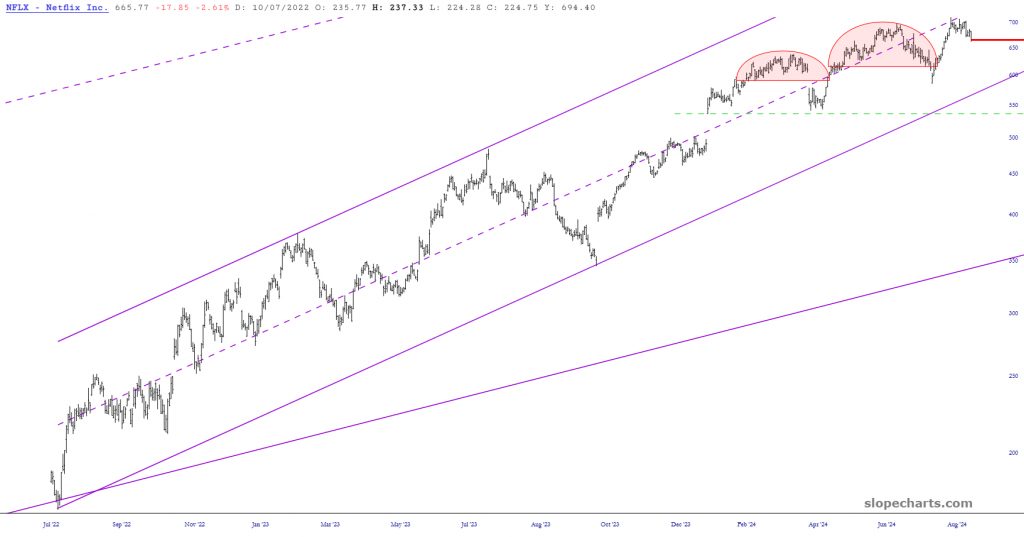
Zooming in a little more closely, we see two small tops have occurred recently, and after a miniature rally from Aug. 5 to Aug. 20, it bumped against the underside of the midline and began to weaken.
It seems Netflix may be an alluring bearish opportunity in the short term because it has a clear path down to the 590s before finding major support. It is “pinned” beneath the midline of its smaller channel right now and, with the overall NASDAQ quite vulnerable, Netflix could easily make a $70 price move (from present price), which for shorter-term put options could be a meaningful gain.
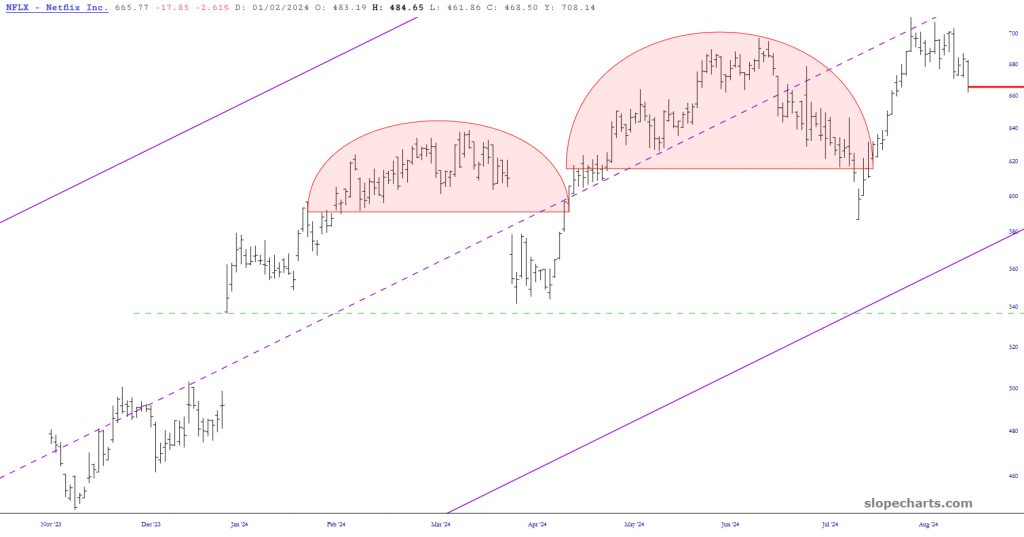
If the supporting line of the channel is, in fact, broken, Netflix might sink as low as its price gap from Jan. 23 of this year, which is just beneath $500. That, it would seem, would be the maximum sensible target for the balance of 2024.
Tim Knight, a charting analyst with 35 years of trading experience, hosts Trading Charts, a tastylive segment airing Monday-Friday. He founded slopeofhope.com in 2005 and uses it as the basis of his technical charting and analysis.