SPACtacular Growth, Mixed Returns
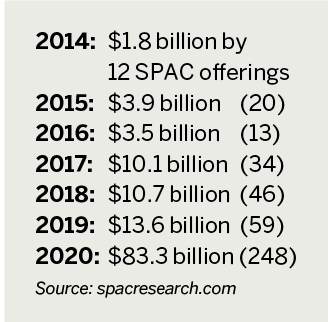
The “blank check” companies known these days as SPACs, or special-purpose acquisition companies, have enjoyed an astonishing burst of popularity. Check out their growth below, as recorded by spacresearch.com.
In other words, from 2014 to 2020, the funds that SPAC offerings raised increased nearly 50-fold.
But spectacular growth has brought investors less-than-impressive results. Those who get in early—before the SPAC acquires a target company—have seen their share values spike higher, while the general public gets in later and usually sees their investments wither away.
Spectacular Flops
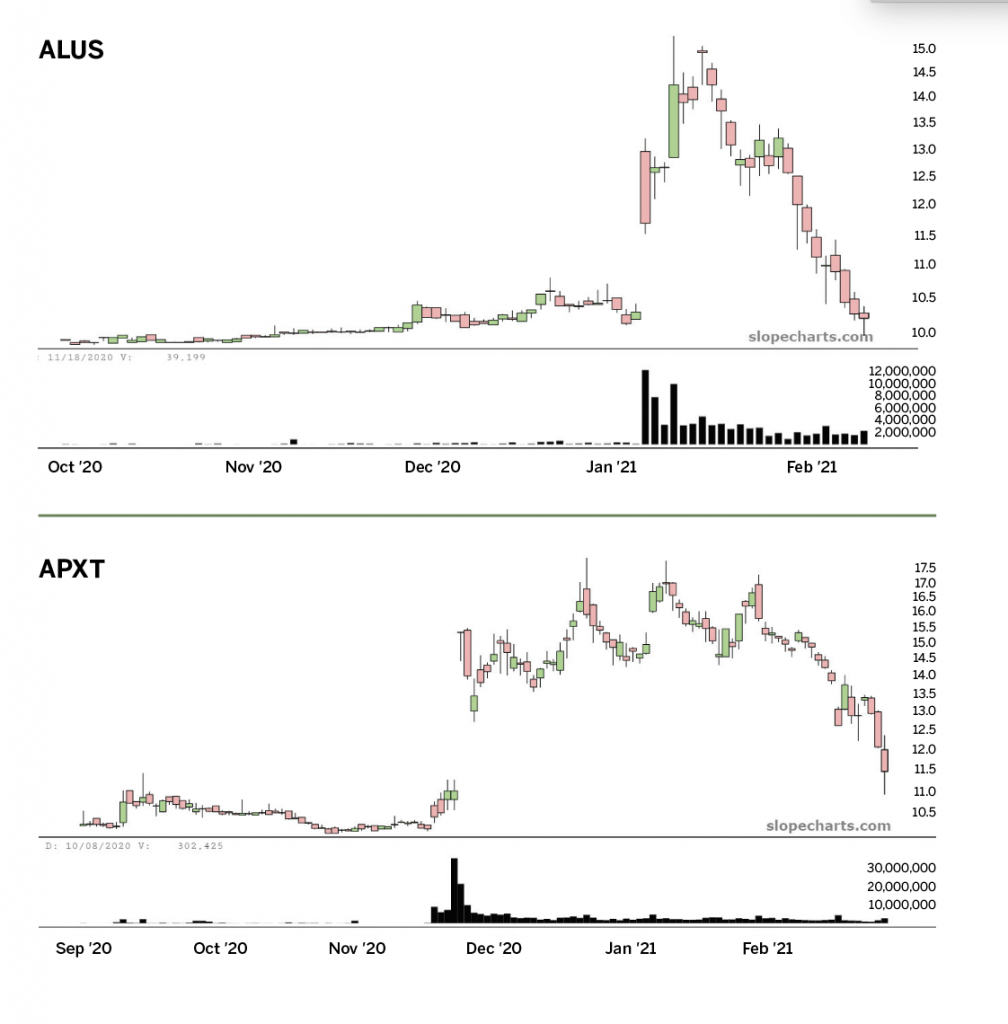
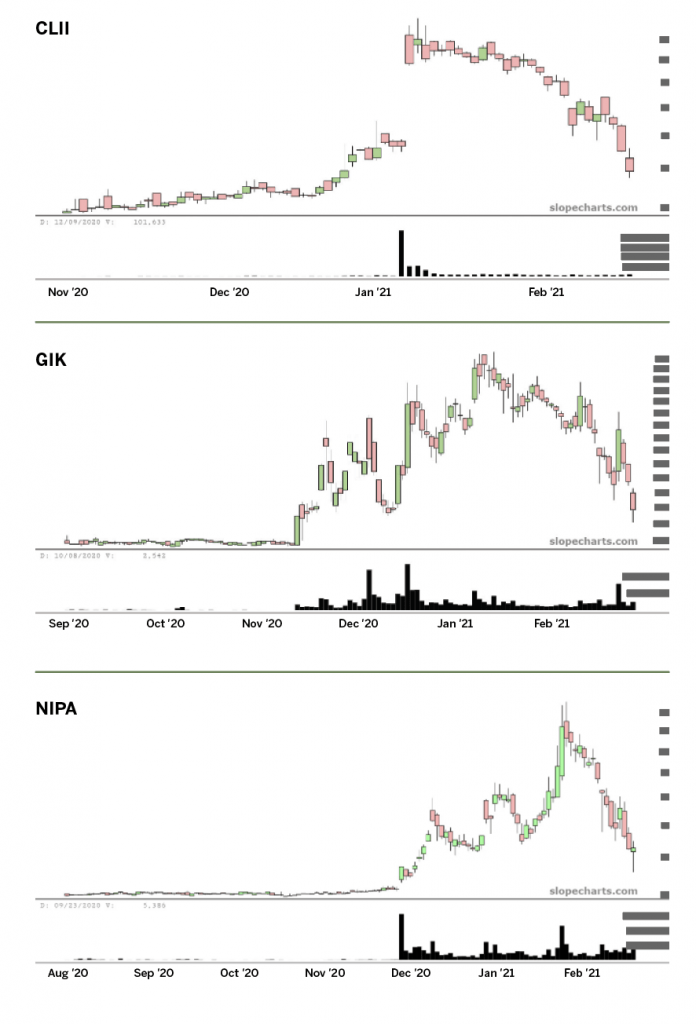
Hundreds of SPAC company charts are available, and many show essentially the same traits:
When SPACs are still simply financial instruments that haven’t acquired a company, their stock tends to trade at basically its cash value, and with hardly any volume at all because there’s no reason anyone would invest with such an indeterminate future.
Once a company is acquired, the volume of trading surges and the price often pushes higher, based on optimism, enthusiasm and the positive attention raised by the former “shell” of a company merging with a profit-seeking enterprise.
Once the proverbial fever has passed, the shares peak and reverse course, often tumbling to almost exactly where they started.
Five examples illustrate this behavior. Fifty such charts could have been offered, but the repetition would not make the point any more clearly.
The Outliers
Not all SPAC stocks resemble an upside-down letter “V,” but even the better-performing issues don’t have much to recommend them. However, they’re still worth examining because some SPAC stocks do eventually behave like stocks that became public via more traditional routes.
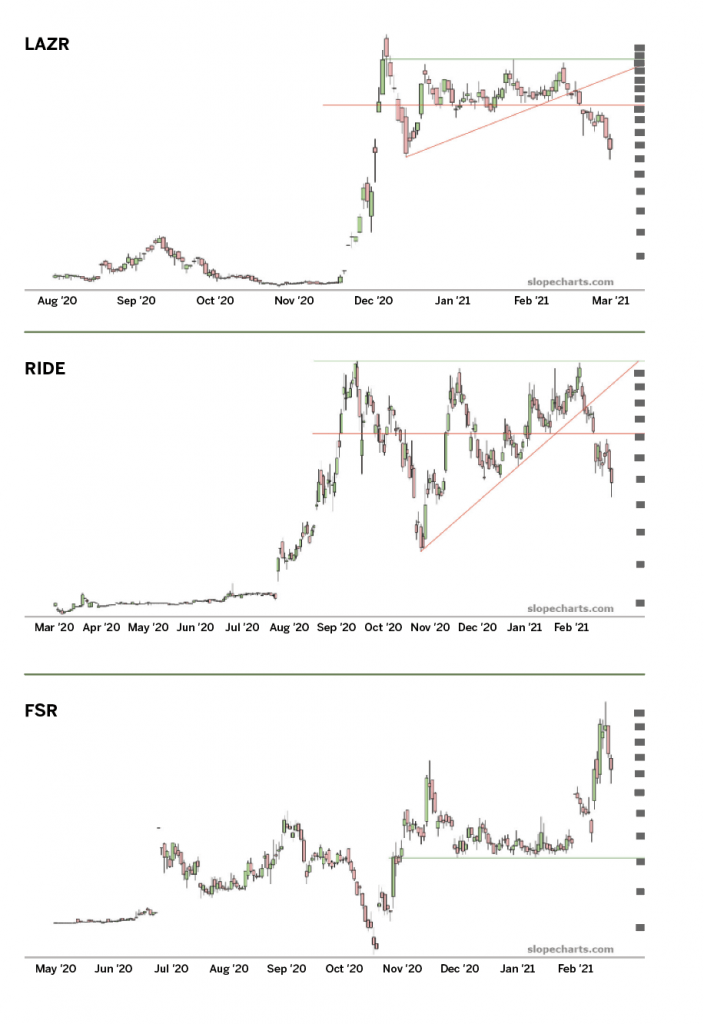
Luminar Technologies (LAZR) had a spectacular run-up in late December and early January as it ascended from about $10 to nearly $50. A 19-year-old whiz kid founded the company and received plenty of attention for its technology for self-driving vehicles.
As a chart, the Luminar price action hammered out a clean right triangle pattern and looked poised to leap higher, but it broke the supporting trendline of its triangle in February, and the pattern failed. It soon found its price at half its peak value from just weeks earlier.
In recent months, companies with anything to do with electric vehicles have attracted investors’ attention because of Tesla’s (TSLA) phenomenal success in the public markets. Lordstown Motors (RIDE) was a SPAC issue that went from about $10 to above $30, similar in style to Luminar, and—also in a similar fashion—sputtered into a fall. The stock made three attempts to get past the $30 level but never did so in a sustainable way. Just like Luminar, it found itself at half its peak price.
Another maker of electric cars, Fisker (FSR), has had a better time of it. Its ascent wasn’t as rapid as Lordstown’s, but its descent has not been as severe. The stock seems to have found a firm foundation just above $14, and it briefly doubled from that price in February 2021. The breakdown in Fisker has been relatively modest compared with other high-flying SPAC stocks.
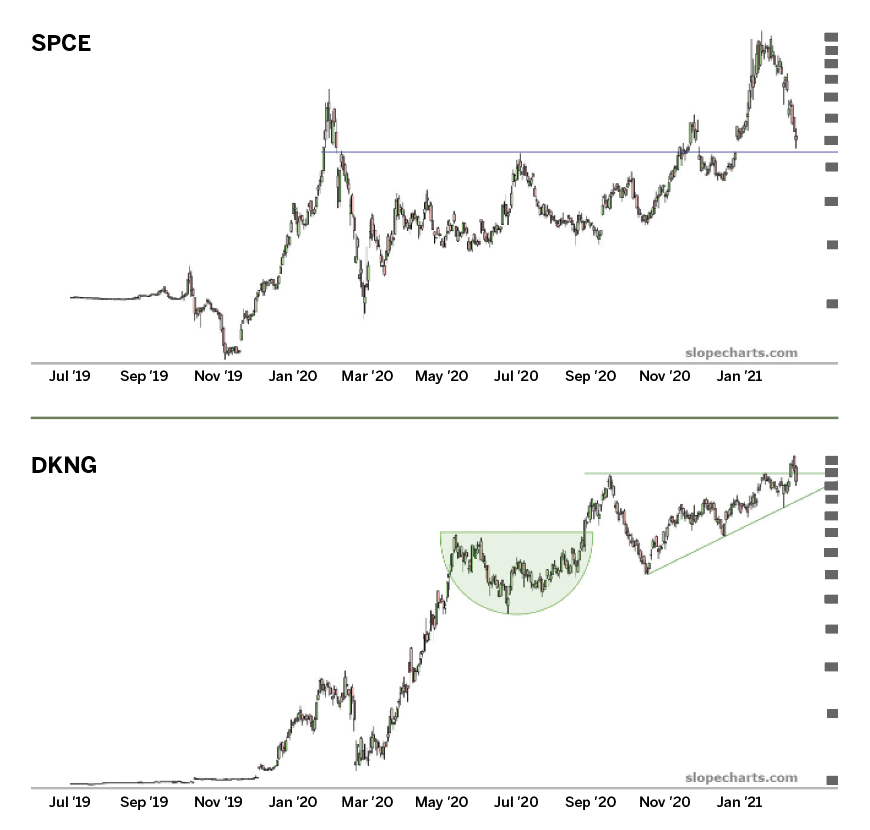
A company featured in the April Luckbox, Virgin Galactic (SPCE), was one of the most successful SPAC offerings. Broadly speaking, the stock has been creating a series of higher highs and higher lows, and it has found relatively strong support at approximately the $28 price level.
Of all the stocks examined here, the healthiest looking is DraftKings (DKNG), which over a couple of years has ascended in price by about 600%. More importantly, the increase in price is within the context of a relatively steady and constructive pattern.
From late 2019 through March 2020, DraftKings had the same kind of “up then down” failure in price that most SPACs have experienced. In sharp contrast to most SPACs, however, the company began to climb steadily in price, pushing past its former high.
Most of its gains took place in just two months—April and May of 2020—when it gained about 400% in price. Then, after creating a saucer pattern, it went on to construct a right triangle pattern, from which it pushed to a lifetime high. The behavior has been somewhat capricious, but it’s a virtual superstar compared with its SPAC brethren.
Run, don’t walk
The performance of SPAC stocks overall should give investors pause. More often than not, the principal beneficiaries of these financial instruments have been the very early investors and the private companies the SPACs acquire. As most of these charts illustrate, SPAC stocks tend to be losers for many passive investors—with notable exceptions, such as Virgin Galactic and DraftKings.
Tim Knight has been using technical analysis to trade the markets for 30 years. He hosts Trading the Close daily on the tastytrade network and offers free access to his charting platform at slopecharts.com.