Three Gaming Stocks with “Personality”
A veteran trader tackles technicals
As strange as it may seem, charts, like people, have personalities. And chart personalities vary widely. Some brave charts seem immune to all but the most severe downturns. Others, such as pharmaceuticals, are at the mercy of news events—good or bad. And still others ebb and flow with the economy in general.
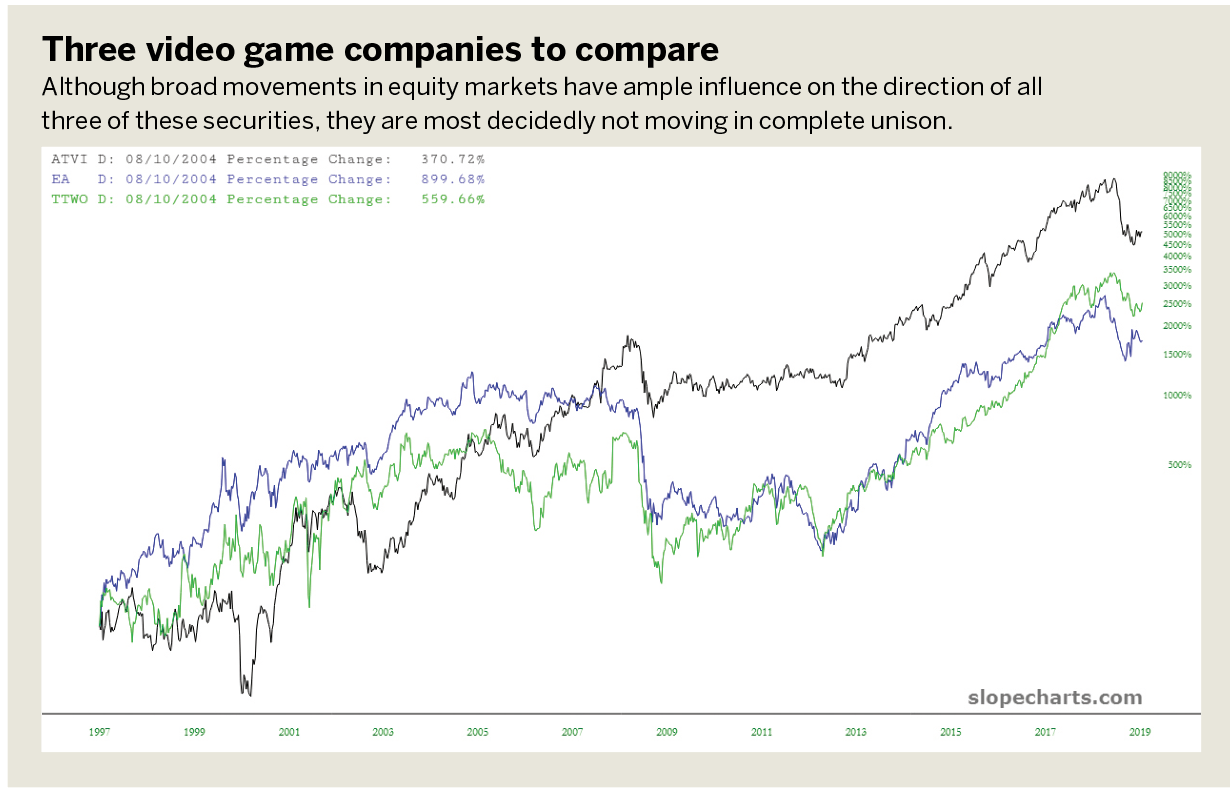
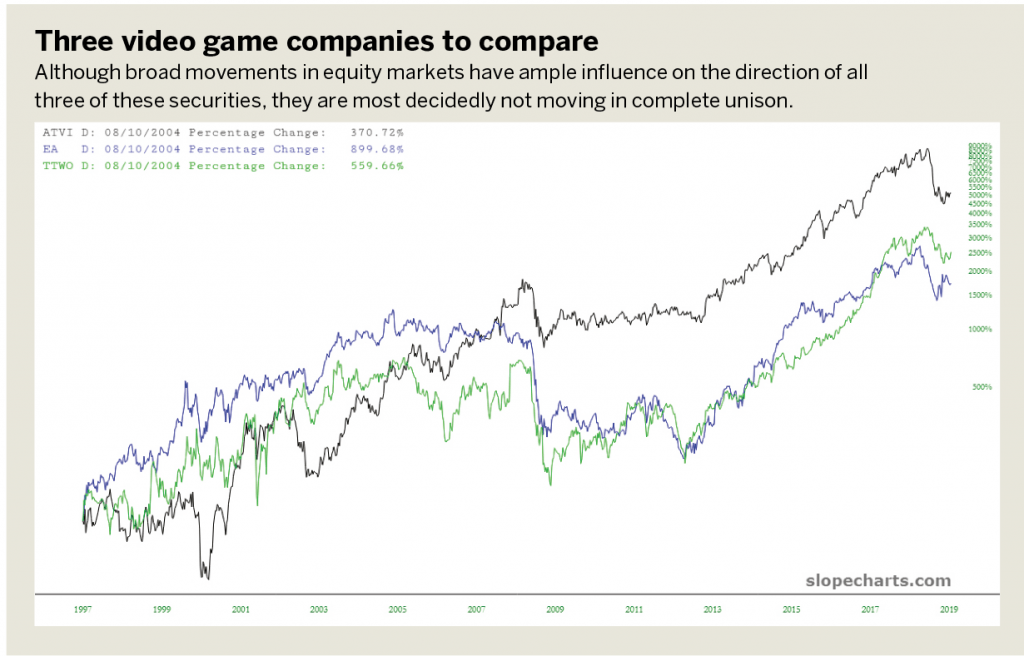
One might assume charts tracing the stock prices of three companies that develop and sell video games might move up and down in virtual lockstep. They are Activision Blizzard (ATVI), Electronic Arts (EA), and Take-Two Interactive Software Inc. (TTWO). Although broad movements in equity markets have ample influence on the direction of all three of these securities, as the comparison chart illustrates in “Three video game companies,” below, they are most decidedly not moving in complete unison.
Take a look at the charts one by one to tease out their own individual personalities. The purpose is to understand the past as well as to help anticipate the future.
Let’s start with Activision (see “ATVI,” below). The chart shows the following:
1. Broadly, the stock has spent the past two decades in a steady uptrend. The uptrend isn’t quite a channel, but the supporting trendline has been a reliable demarcation of support/resistance since the late 1990s;
2. In the context of this uptrend, there were well-formed rounded tops in 2001 and 2008, which produced meaningful drops in price;
3. A third top has completed relatively recently, and the stock has already suffered weakness;
4. Perhaps most importantly, the price bars broke the uptrend in December 2018, and as if to affirm the new role of this line as resistance, price bars have been precisely bouncing off the underside of this now-broken trendline ever since.
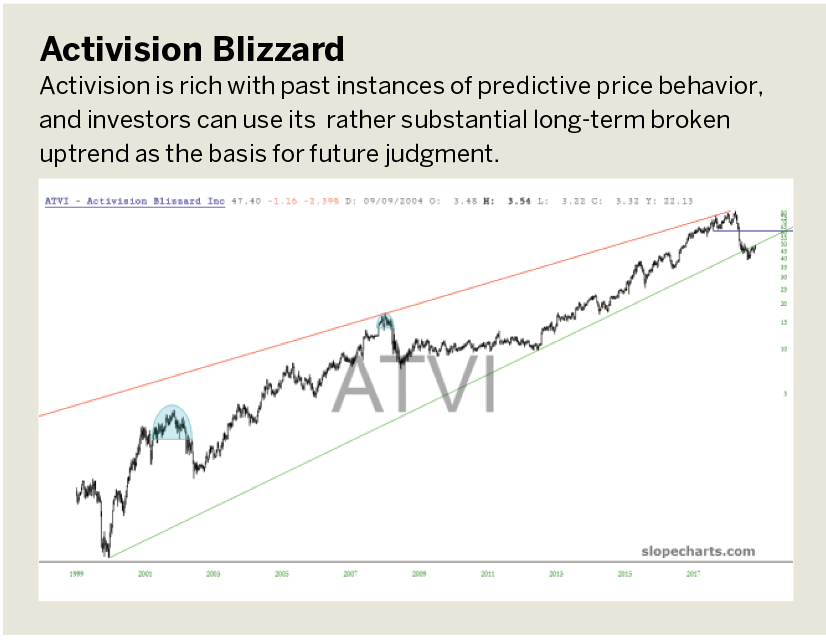
Therefore, Activision is rich with past instances of predictive price behavior, and there’s a rather substantial long-term event in the form of the broken uptrend to use as the basis for future judgment.
Electronic Arts is a financial instrument with strikingly different behavior:
1. It had a tremendous and well-formed top from 2005-2007, following by a plunge in price, suggesting much more typical behavior of the market as a whole;
2. After several years of seeking stabilization, Electronic Arts entered into a persistent and steady uptrend from 2012 to 2017;
3. Over the past year, as the stock has been weakening, it has been forming a steady series of price “shelves” in the form of horizontal lines that represent lower levels of resistance;
4. Just as it “obeyed” the supporting trendline for five years, prices in turn became compliant with the more recent descending trendline.
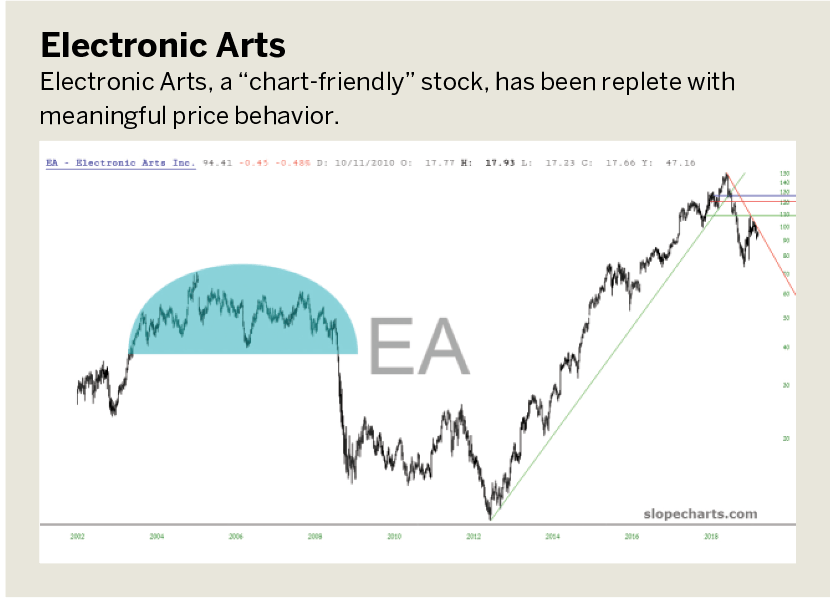
Electronic Arts
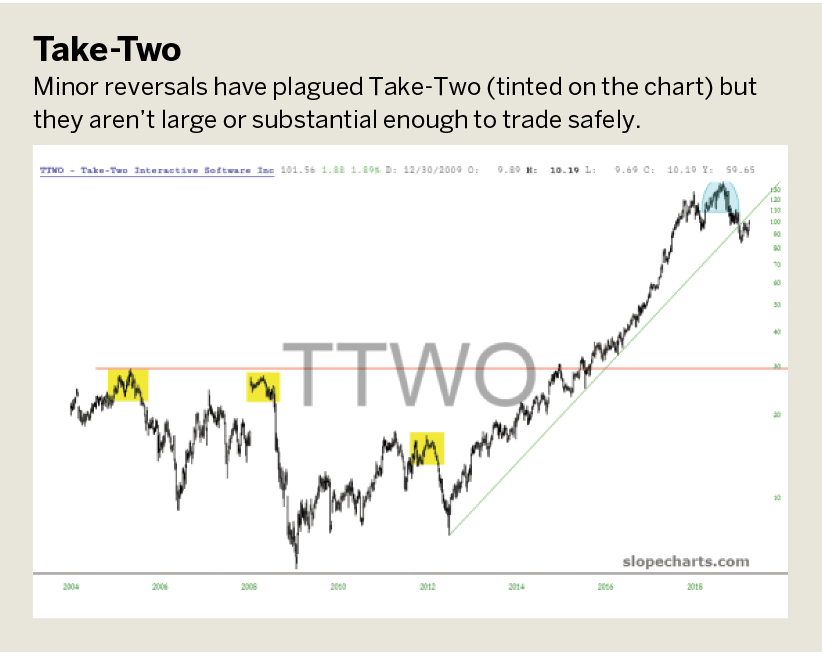
Of these three, the least “feature-rich” chart is of Take-Two (see “TTWO,” below), which has shown itself:
1. Prone to minor reversals (tinted on the chart); although the reversals aren’t large or substantial enough to trade safely…
2. Like EA, it enjoyed a steady uptrend from 2012 to 2017;
3. And, also like EA, it has broken this uptrend.
So, Take-Two and Electronic Arts have far more in common with one another than either of them share with Activision.
The ocean of trading’s countless waves, currents and cross-currents prevents any computer or human from predicting with certainty what’s coming next. However, by understanding the previous price behavior and patterns of any particular stock (or commodity, crypto or anything else tradable), investors can achieve a familiarity that helps equip them to anticipate what is most probable in the coming weeks or months.
Tim Knight has been using technical analysis to trade the markets for 30 years. He founded Prophet Financial Systems and offers free access to his charting platform at slopecharts.com.