Trading Robotics Like a Robot
A veteran trader tackles technicals
Intuitive Surgical (ISRG), one of the world’s best-known and most heavily traded robotics stocks, has climbed in value from as little as $2 to more than $500 per share in the nearly two decades it’s been a public company.
For “buy and hold” investors, this stock has worked out well. However, it makes an interesting trading vehicle, too, so it’s instructive to explore opportunities that have arisen because of its upswings and downturns. After all, it didn’t make the move from $2 to $500 in a straight line.
A couple of good basic choices for entry and exit signals include the Williams %R and the exponential moving average (EMA). In the spirit of robotics, investors can test these trading signals mechanically and use automated processing of past data to help find good figures to use as the parameters.
When using these indicators, investors can use well-established, popular parameters, such as a 50-day moving average or 14-day %R. Nearly everyone else uses those values, but why not study the stock’s history to tease out which ones worked? Let’s start with the Williams %R and use past data to test hypothetical trades for all possible parameters. The basis of the hypothetical trades is that the investor would buy Intuitive Surgical if the Williams %R crosses above the -75 line based on “N” days, and that position would be sold when it crosses back below the -25 line. Instead of simply guessing what value to use for “N,” the computer surveys the historical database and offers its own recommendation of 200 days.
Minimizing guesswork
Rather than guess for “N,” the computer surveys the historical database and offers its own recommendation of 200 days, with mostly gratifying results.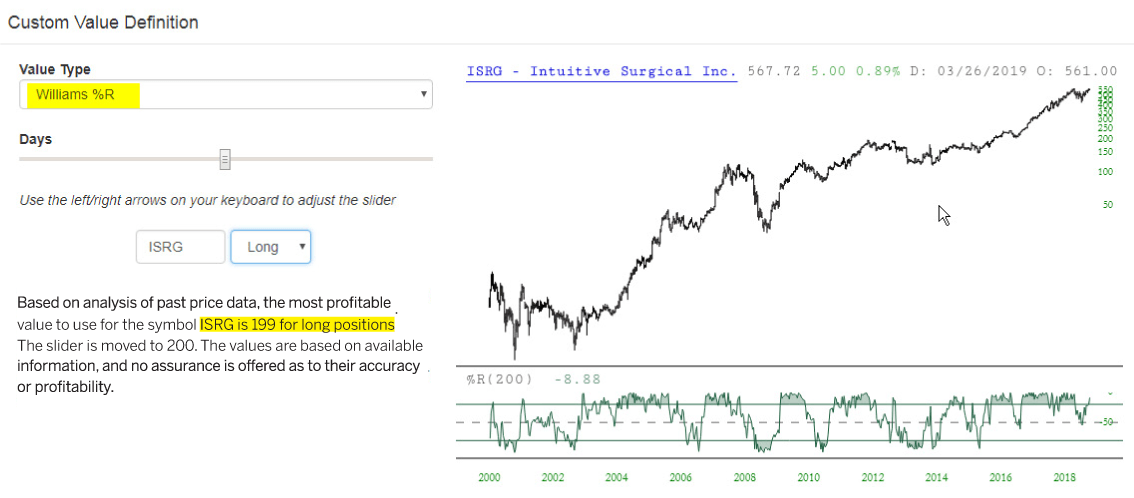
Using that value of 200, one can find what the results would have been if this rule were followed through the entire history of the stock. The results are impressive: 83% of the trades were winners, and the percentage gains were much larger than the losses. Overall, each trade produced a 25% return. It’s also interesting to know the quantity of trades was quite modest and reasonable: just a dozen over the entire test period.
Stellar Results
Using the Williams %R based on historical performance, most of the resulting trades were impressively profitable.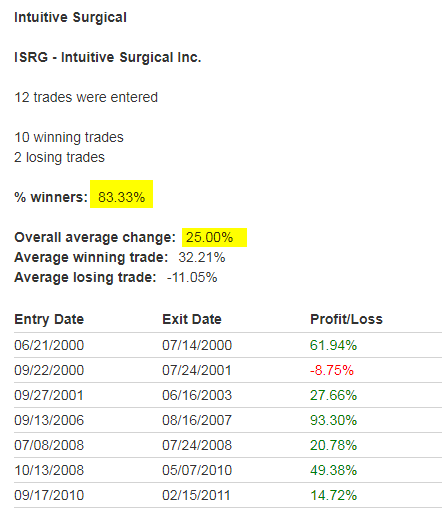
Below average
Computer testing indicated a 199-day exponential moving average that produced lackluster results.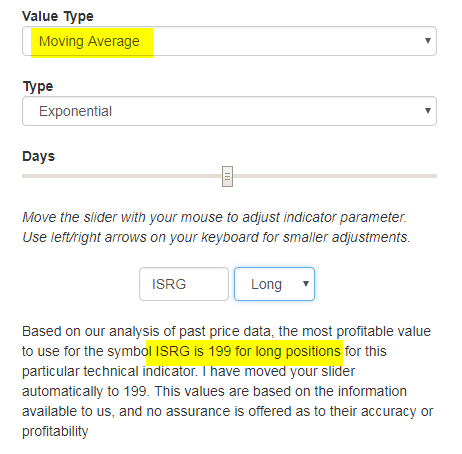
As good as those results are, it makes sense to try a similar experiment, this time with the exponential moving average indicator. In this instance, the computer assumes it would have purchased Intuitive Surgical when the closing price crosses above the “N”-day EMA and would have sold the position when crossing below the same EMA. Having analyzed all the past data, it recommends a 199-day EMA.
So much for so little
The exponential moving average indicator recommended 101 trades, most of them losers that dragged down the average from the single highly profitable trade.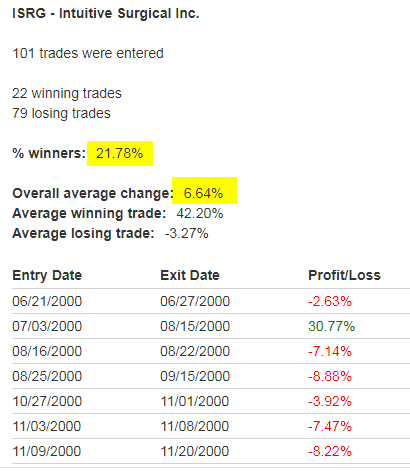
The trading results, however, are dismal. First, the quantity of trades is much greater: 101. And even though the percentage gains from the winning trades was impressive, the number of losing trades dwarfed the winners, dragging the overall average result to 6.64%, about one-quarter as good as our %R idea.
Using the (Williams %R) value of 200 brought impressive results: 83% of the trades were winners
Testing produces winners
Using just two indicators, investors can create a potentially profitable trading system. In the Intuitive Surgical example, green marks winning trades and red indicates losers.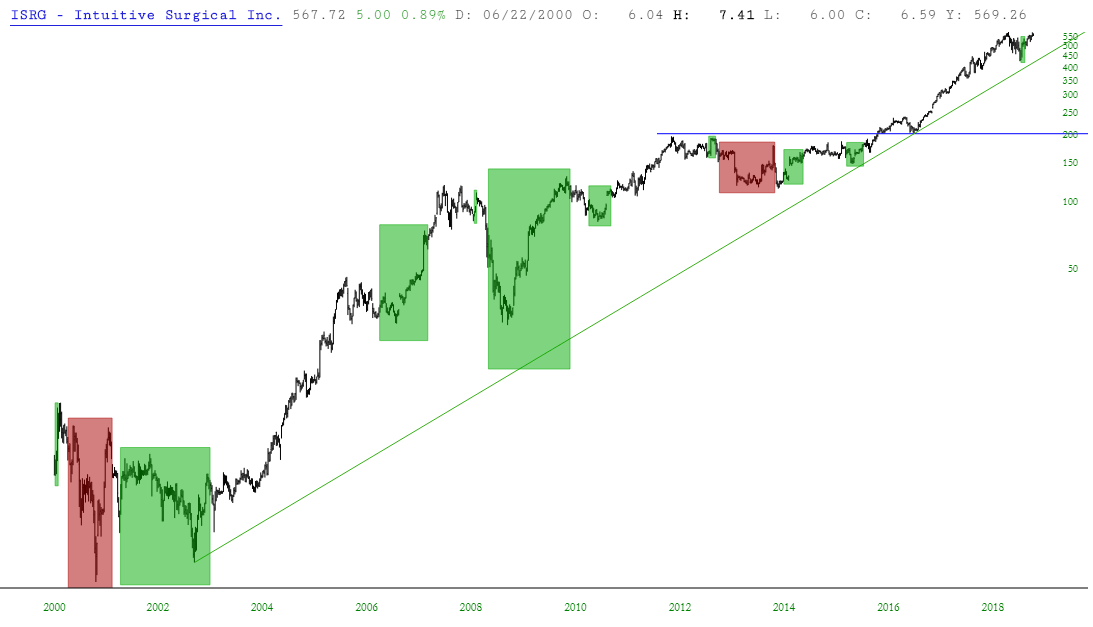
Investors can apply this mechanical and “robotic” approach to trading any financial instrument, whether it is involved with robots (as Intuitive Surgical is) or not. What makes Intuitive Surgical interesting is the strength and regularity of its up-and-down moves. With just a small amount of testing, by way of the two aforementioned indicators, investors can hone in on a simple and potentially profitable trading system, whose historical results are portrayed in this chart (with green marking the winning trades and red marking the couple of lonely losers).
Tim Knight has been using technical analysis to trade the markets for 30 years. He founded Prophet Financial Systems and offers free access to his charting platform at slopecharts.com.