Trades
The VIX Cheat Sheet
Interested in knowing how much the S&P 500 is expected to move? This cheat sheet will help! But first, get the last sale of VIX or type “VIX” into your search engine. Then, look up the corresponding VIX level and the outlook for the desired theoretical expected range.

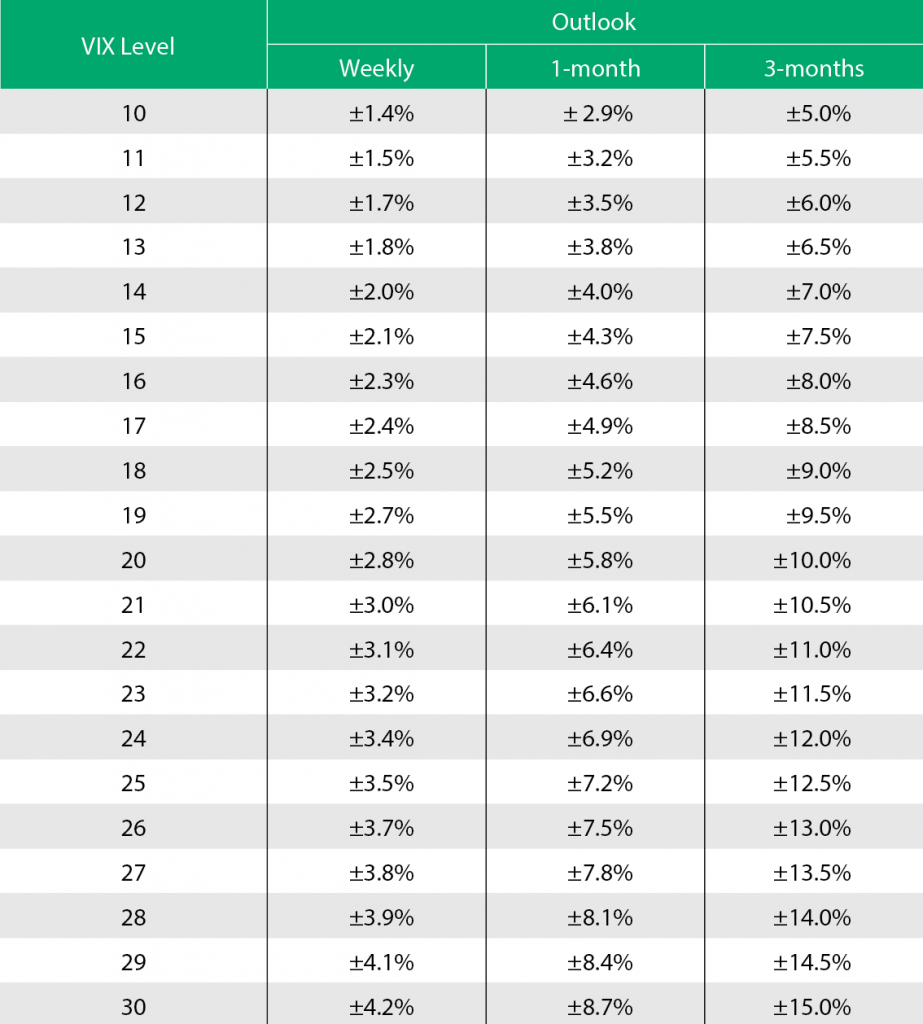
For example, in late August, the price of VIX was 20. The table to the right shows the one-week outlook at ±1.4%, one-month outlook at ±5.8%, and the three-month outlook at ±10.0%. This is where prices are expected to range, plus or minus.
The greater the outlook with respect to time and the greater the VIX levels, the greater the expected price ranges. Additionally, all expected ranges are plus or minus (±) and based on where prices are expected to range with a 68% probability at the end of one month or three months. The 68% probability, by the way, is based on a one-standard deviation. To find where prices are expected to be with a 95% probability, double the numbers from the charts.
For example, with a 95% probability and a VIX of 20, the S&P 500 is expected to fall within 5.8% x 2 = ± 11.6% within one month. For weekly VIX updates, sign up for the Cherry Picks newsletter at tastytrade.
Michael Rechenthin, Ph.D., (aka “Dr. Data”) is head of research and data science at tastytrade.
Cherry Picks
-
The Diversification Myth
|Buying a wider variety of stocks won’t decrease risk much if their prices are closely correlated -
Fundamental Intelligence
|Getting smart about these AI stocks begins with an understanding of the basics Be smart picking stocks in the artificial intelligence sector by considering the fundamentals of 12… -
Good Pharma Karma
|The healthcare sector is set to contribute to your bottom line The market downturn has been kind to the healthcare sector. The S&P 500 (SPY) dropped 16% since the beginning… -
Affordable Futures
|Retail investors can use new smaller futures contracts to hedge their portfolio bets Hedge fund managers and other big investors have been using futures to reduce risk for years, but… -
Six Traders, Six Trades
|A trading committee offers long- and short-term strategies for the new year Tony “BAT” Battista Bullish investors looking to take a long-term view could consider a very wide broken wing… -
2 Trades for the Cautious Gold Bug
|Here’s how investors can make money from the glittering precious metal, even when it’s declining in value Many in the financial world think of gold as a safe investment and… -
Home in on Cyclical Stocks
|Use a counter position to take advantage of the volatility of equities that move with the market -
The Blunt Truth About Pot Stocks
|Cannabis-related stock prices are falling as the nation awaits federal decriminalization After the 2020 U.S. presidential election, cannabis stocks reached new highs as the nation waited for President Joe Biden… -
6 Looks at Energy Stocks
|Crude oil prices of more than $100 a barrel are boosting stock prices in the petroleum sector, but the effect on the S&P 500 is limited because the commodity accounts… -
Futures Notional Values, the Crude Oil Curve and Current Index Skew
|Current Futures Notional Values Below are the current notional values for popular futures contracts. We also included their ETF approximate share equivalence, as well as their correlations to the ETFs.… -
Drawdowns, Data Sources and Trades Ideas
|What kind of drawdowns can be expected if you bought at the absolute worst time every month? Here are the 30-day drawdowns, over the past five years, of buying at… -
Backtest and Forward Test with Lookback
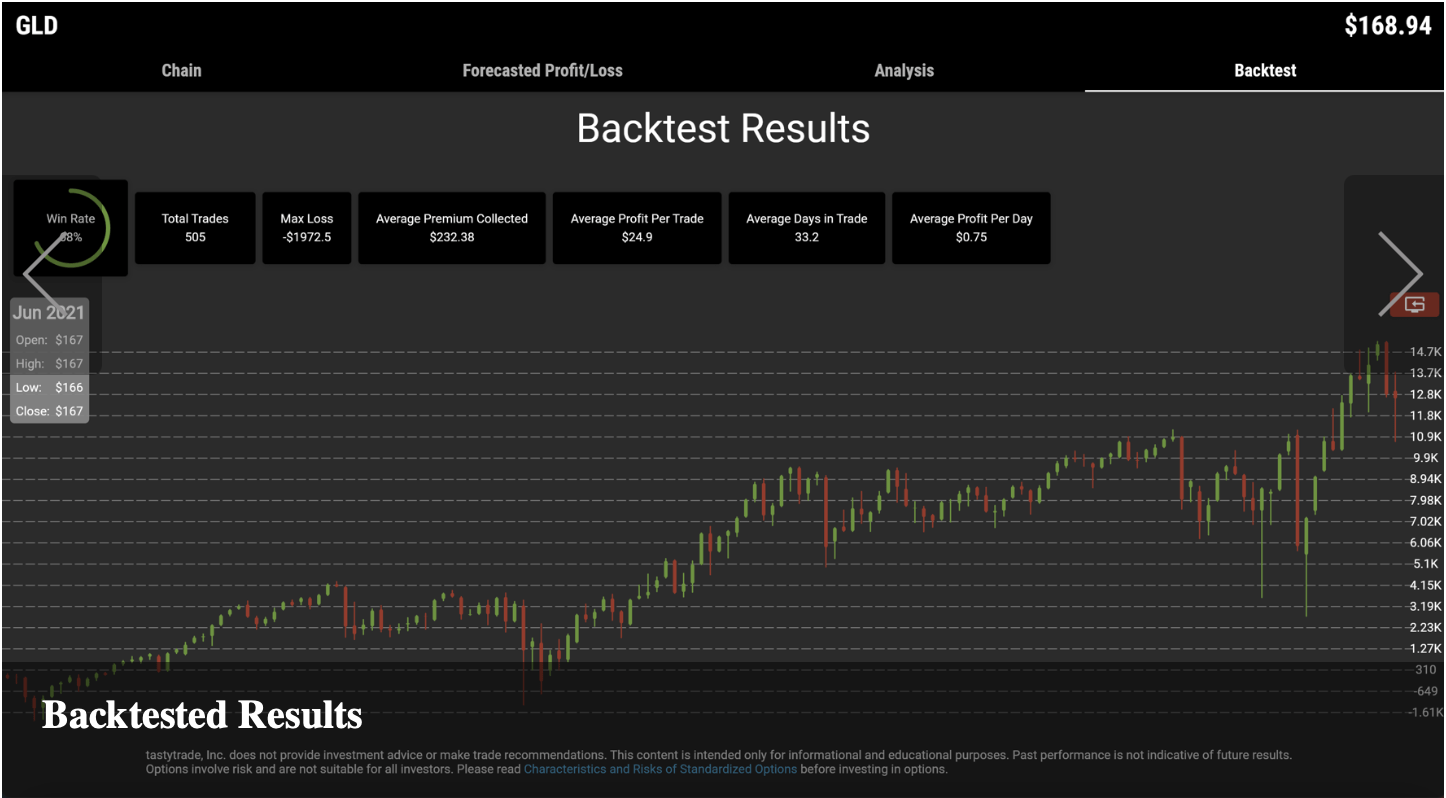
|See how a strategy performs before risking money on a trade Lookback, a free options analysis tool from tastytrade, provides two ways of examining the profit and loss around an… -
Correlations, Volatilities and Meta
|If you like X, you might also like A, B and C Take a look at the three most correlated stocks for every stock in the Nasdaq 100. We are… -
Historical Volatility and Implied Volatility
|Free Download – Historical Volatility and Implied Volatility In this morning’s Cherry Picks, we are providing a free download of approximately 1,100 stocks and ETFs along with their historical and… -
The One with All the Earnings
|Earning Season, Birds of a Feather Flock Together Earning Season “officially” begins with the big banks. See the graphic below that shows the number of sectors that report per day.… -
Yields, S&P Sector Performance and Earnings
|Yields on the Move With all the discussion of yields in the news lately, it is nice to see what’s moving. As seen on the graphic below, most of the… -
Seeking Diversity
|Rather than seeking to predict the next big thing, consider buying any of these 20 tickers to diversify a portfolio in the new year When all of the stocks and… -
What’s going on with the market?
|Take a look at the major indices (SPY, IWM, QQQ) and the equity sectors. Discretionary (XLY) is down the most over the past month, while Health Care (XLV), Real Estate…


