Approval Ratings, Presidential Predictions & Stimulus Implications
As outlined by Luckbox in October, some historically reliable presidential election prediction models, data and opinions have suggested conflicting results regarding the 2020 electoral outcome.
With election day less than a week away, it’s worth reviewing some last-minute prediction considerations as well as a brief analysis of some potential impacts of different outcomes.
One important election indicator not previously discussed by Luckbox involves presidential approval ratings. A presidential approval rating is determined through polling whereby poll respondents are usually asked, “Do you approve or disapprove of the way that the current president is handling his or her job as president?”
The “up” or “down” nature of this poll results in two groups of distinct data that are reported in percentage terms. So, if 60 of 100 respondents answer “approve,” and 40 of 100 respondents answered “disapprove,” then the president’s overall approval rating would hypothetically be 60%.
President Donald Trump is somewhat unique because his approval rating has never been above 50%. And if the president loses his reelection bid on Nov. 3, he would become the first president in modern history to never notch an approval rating above 50%.
For comparison, former Presidents George W. Bush and Barack Obama reached maximum approval ratings of 90% and 67%, respectively.
Outside of serving as a barometer for presidential job performance, approval ratings are critical because they have also served as reliable predictors of an incumbent’s likelihood of winning reelection. Historically, every incumbent with an approval rating above 50% has won reelection, while incumbents with approval ratings below 50% have lost on every occasion going back to 1948.
The last two incumbents to lose reelection bids with sub-50% approval ratings were Presidents George H. W. Bush (37% approval rating) in 1992 and Jimmy Carter (32% approval rating) in 1980.
Naturally, one might wonder how Trump has fared in terms of approval ratings. As of Oct. 6-9, the ABC News-Washington Post poll estimated Trump’s approval rating at 44%—well below the 50% threshold.
Mirroring those results closely, polling conducted by Gallup registered an approval rating for Trump of 43% during the period between Sept. 30 and Oct. 15. It should be noted that Gallup has calculated an average approval rating of 41% over the course of President Trump’s tenure.
The reason why presidential approval ratings are so integral for predicting the outcomes of presidential elections is because they are generally reflective of the share of the vote the incumbent is expected to win. For example, when President George H. W. Bush lost his reelection bid to Bill Clinton in 1992, he received 37% of the popular vote—a percentage that exactly mirrored his approval rating.
Of course, one must bear in mind that Trump’s approval rating could move higher in the final few weeks—or days—before the election. That could tighten the race, and put this predictive indicator’s streak of success in jeopardy.
Currently, FiveThirtyEight estimates that Trump’s approval rating is 43.2%—on par with the recent findings by the ABC News-Washington Post and Gallup ratings.
A second-level indicator that readers can follow leading up to the election is President Trump’s approval rating in key swing states. Listed below are the president’s estimated approval rating in those states (Gallup data):
- Arizona: 41%
- Florida: 41%
- Georgia: 41%
- Iowa: 43%
- Michigan: 40%
- North Carolina: 40%
- Ohio: 45%
- Pennsylvania: 42%
- Wisconsin: 41%
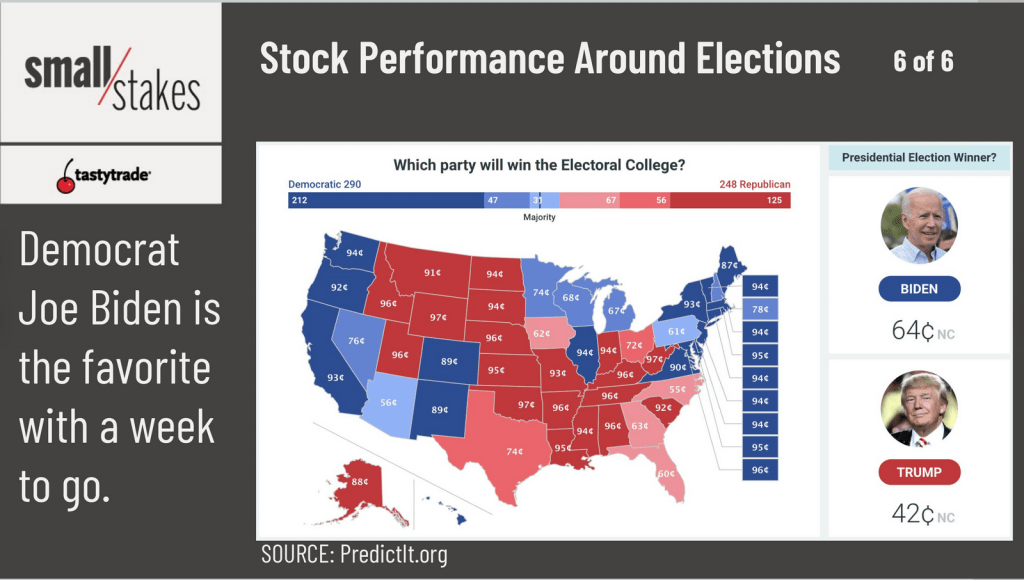
The data above suggests Trump faces a tough challenge in his reelection bid and is consistent with nationwide polling on the ultimate outcome of the election, indicating that former Vice President Joe Biden is a strong favorite to win the Oval Office on Nov. 3. FiveThirtyEight currently gives Joe Biden an 88% likelihood of victory.
Betting odds support this outcome as well, as reflected by Predictit.org data below.
While investors and traders likely have their own strong, personal preference for the election, it’s important to prepare for either outcome from a risk management perspective.
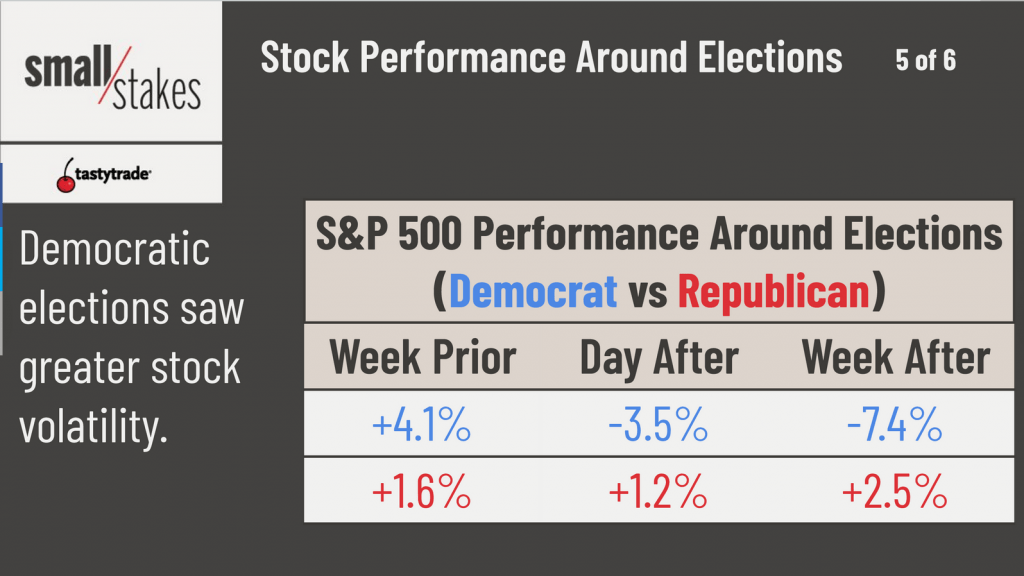
The good news is that historical data suggests that the long-term prospects of the stock market are very strong no matter who wins on Nov. 3. Going back to 1945, the S&P 500 has averaged an annual gain of 11.2% with a Democrat in the White House, and an average annual gain of 6.9% with a Republican.
Recent research by the tastytrade financial network suggests, however, that in the near-term, the stock market could react in a more volatile fashion if the incumbent loses.
The respective historical responses of the stock market, on average, in the aftermath of either a Republican or Democratic victory are illustrated below.
One wildcard in the current election cycle is the importance of the race to control the Senate.
With the economy stuck in neutral due to the recession and ongoing pandemic, most economists (including leaders at the Federal Reserve) believe that additional fiscal stimulus is needed at this time.
Prevailing opinion suggests that both parties will stop playing politics after the election, increasing the likelihood of a stimulus package being passed in the near future regardless of who wins the White House.
With an extra trillion dollars of stimulus money hanging on the outcome of the Senate race, investors and traders should be closely monitoring these elections as well—no matter their political preference.
To review the election’s potential near-term impact on the financial markets, readers are encouraged to review a recent episode of Small Stakes on the tastytrade network.
To follow all the daily action in the markets, readers can also tune into TASTYTRADE LIVE, weekdays from 7 a.m. to 4 p.m. Central Time.
Sage Anderson is a pseudonym. The contributor has an extensive background in trading equity derivatives and managing volatility-based portfolios as a former prop trading firm employee. The contributor is not an employee of Luckbox, tastytrade or any affiliated companies. Readers can direct questions about any of the topics covered in this blog post, or any other trading-related subject, to support@luckboxmagazine.com.