Crypto Might Not Be a True ‘Safe Haven’
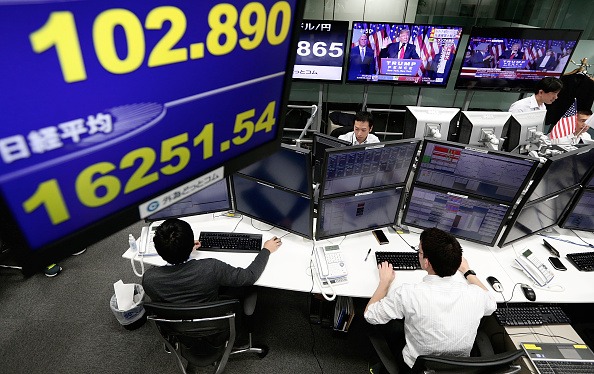
“Safe havens” are traditionally defined as niches of the financial markets that retain, or even gain value, during periods of heightened volatility. Recent activity in the cryptocurrency sector suggests it may not be the “safe haven” it once was.

Safe havens are traditionally defined as niches of the financial markets that retain, or even gain value, during periods of heightened volatility. Market participants typically seek out safe havens in order to help limit losses—or make positive returns—amidst downturns in the stock market.
During the last couple of financial crises (the great recession and the COVID-19 pandemic), global investors and traders fled to government bonds as a place to park their cash. Precious metals such as gold, silver and platinum have also traditionally been used as safe havens, although arguably less so in recent years.
Of course, the definition of a “safe haven” truly resides in the eyes of the beholder.
During periods of heightened stock market volatility, some investors and traders may simply elect to hold cash—cash that can be used as an emergency reserve for personal expenses, or for capitalizing upon new investment/trading positions amidst a correction.
From a technical standpoint, what’s most important to recognize is that safe haven investments shouldn’t be highly correlated with the stock market. Because if one’s designated safe haven shares a strong positive correlation with the stock market, the value of the safe haven position would theoretically move in tandem with the stock market.
That scenario would defeat the entire purpose of a safe haven.
Considering the rising influence of cryptocurrencies in the global financial markets, it’s worth considering whether this emerging asset class technically qualifies as a safe haven. Recent trends suggest that isn’t the case.
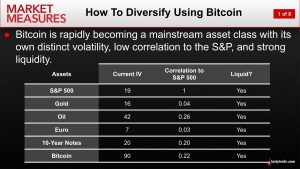
When cryptocurrencies first emerged on the scene, they exhibited very little correlation with the broad stock market indices. For example, a previous market study conducted by the tastytrade financial network indicated that Bitcoin’s correlation with the S&P 500 was about 0.22, as illustrated in the graphic below.
As a reminder, correlation—as it relates to the financial markets—refers to the degree to which securities/assets move in relation to each other.
For example, when two underlying securities are positively correlated, that means they move in the same direction—to varying degrees. On the other hand, when two securities are negatively correlated, that means they move in opposite directions—to varying degrees. If no correlation exists between two securities then the relationship is often categorized as “zero correlation.”
Market correlations are typically expressed as a number between -1 and +1.
So when two underlyings are positively correlated—meaning they move in the same direction—the correlation will range between 0 and 1. And when two securities are negatively correlated—meaning they move in opposite directions—the correlation will range between -1 and 0.
According to this scale, the positive correlation between Bitcoin and the S&P 500 would be considered fairly weak at 0.22. That means on some occasions the price of Bitcoin moves in tandem with the S&P 500, but on the majority of occasions, it does not.
However, one must keep in mind that market correlations can shift over time, and can also shift with the investment environment.
Generally speaking, correlations in the market tend to increase during periods of heightened volatility because investors and traders become less focused on nuances in the market, and instead often elect to “sell, sell, sell” without prejudice. In complacent markets, correlations tend to decrease as investors and traders chase a diverse group of investing/trading ideas and strategies across the financial spectrum.
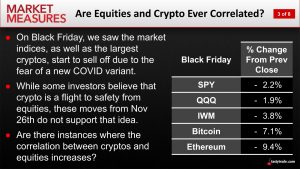
During the most recent correction in the stock market, in late November of 2021, the cryptocurrency sector exhibited a stronger correlation to the stock market than many would have likely expected, prior to the selloff.
As illustrated in the graphic below, bitcoin and ethereum plunged alongside the stock market during the Black Friday correction. Interestingly, the correction in the cryptocurrency sector was even more pronounced than the correction in the “traditional” financial markets.
Considering that the previous correlation between the stock market and Bitcoin was 0.22, the above data begs the question—has the correlation between these two asset classes changed? Or was the timing of the recent selloff in both asset classes merely a coincidence?
More data (i.e. future corrections) will likely be required to make any sweeping conclusions.
In the meantime, investors and traders may want to tread cautiously when it comes to treating the cryptocurrency sector as a so-called “safe haven.”
Of course, the aforementioned data doesn’t speak to the broader investment case for the cryptocurrency sector, which will vary by investor—according to his or her market outlook and appetite for risk.
To learn more about the correlations between the crypto sector and the stock market, readers are encouraged to review this new installment of Market Measures on the tastytrade financial network.
For timely updates on everything moving the financial markets, readers can also tune into TASTYTRADE LIVE—weekdays from 7 a.m. to 4 p.m. CST—at their convenience.
Sage Anderson is a pseudonym. He’s an experienced trader of equity derivatives and has managed volatility-based portfolios as a former prop trading firm employee. He’s not an employee of Luckbox, tastytrade or any affiliated companies. Readers can direct questions about this blog or other trading-related subjects, to support@luckboxmagazine.com.