History Says the VIX Will Rally Again in Fall
The CBOE Volatility Index (VIX) tends to rally in September and October

Historical data shows that volatility in the stock market traditionally peaks in September and October.
- The CBOE Volatility Index (VIX) trended toward 52-week lows in July 2023.
- The VIX is currently trading 14, which is below the average levels observed last year, when the VIX consistently traded above 20.
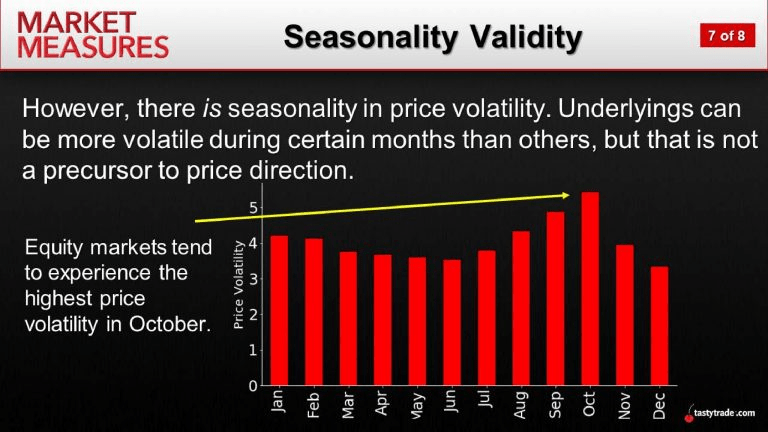
- Traditionally, stock market volatility tends to rise in autumn—historical data shows that September and October tend to be the most volatile on the calendar, on average.
Starting on July 10, the Dow Jones Industrial Average embarked on its longest consecutive winning streak since 1987—13 up days in a row.
Against the backdrop of summer, that type of run is the quintessential definition of “complacency” in the financial markets.
Nobody knows for sure how long the current spell of tranquility will last, but history suggests that volatility will return to the markets sometime soon. Traditionally, volatility tends to dip in summer, when many active investors are away from the office for summer vacation.
However, that dip tends to last only so long—historical data shows that September and October are traditionally the most volatile months on the calendar (on average), as illustrated in the chart below.
The CBOE Volatility Index (VIX) spent most of July trading at 13 and change, which is well below the levels observed last year, when the VIX consistently traded above 20.
Past performance is certainly no guarantee of future results, but the aforementioned information suggests that the VIX won’t be trading in the low teens come fall.
As most active market participants are well aware, the VIX shares a relatively strong inverse correlation with the major market indices. So when the Dow Jones Industrial Average (or S&P 500) is moving higher, the VIX is usually trending lower—and vice versa.
The Dow Jones bottomed earlier this year amidst the regional banking crisis, and hasn’t looked back. Since March 17, the Dow Jones Industrial Average is up about 12%.
However, performance in the tech-heavy Nasdaq 100 index has been far stronger. The Nasdaq 100 is up over 40% in 2023, after losing more than 30% in 2022. Those are some massive swings, which may be an indicator that further volatility may lie ahead.
Interestingly, another well-known volatility metric has also been trending higher, which suggests that investors and traders are already planning for elevated volatility at some point in the foreseeable future.
Skew Index Trending Toward 52-Week Highs
In addition to the VIX, many investors and traders monitor the CBOE Skew Index (SKEW). The two metrics are similar, but offer slightly nuanced views of risk sentiment in the financial markets.
The VIX is calculated using at-the-money (ATM) options in S&P 500, whereas the Skew Index is calculated using out-of-the-money (OTM) options in the S&P 500. As a result of this subtle difference, the Skew Index is often viewed as an indicator of “tail risk” in the stock market.
Tail risk refers to a form of portfolio risk that captures the remote probability that the value of a given investment could move by more than three standard deviations from its current value. Visualizing a normal bell curve of investment returns, tail risk is therefore captured in the extreme ends of the curve—encompassing rare (and typically eye-popping) outcomes.
Like the VIX, interpreting the Skew Index is relatively easy. Traditionally, the Skew Index trades between roughly 100 and 170, as highlighted in the chart below.
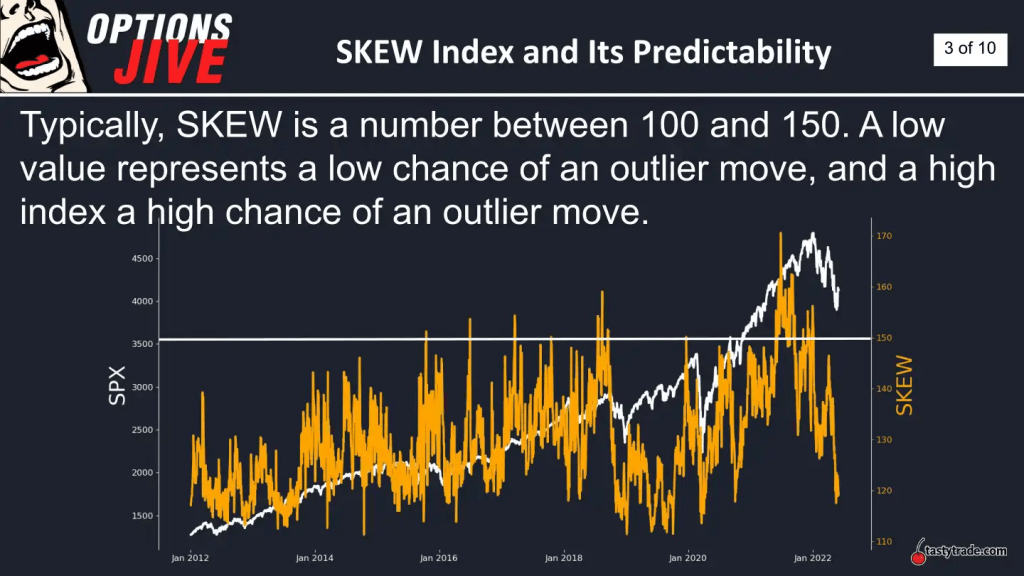
A lower reading in the Skew Index (100-120) generally translates to a complacent risk environment, whereas an elevated reading in the Skew Index (150 and above) indicates that expectations for a big move in the market are rising (or peaking).
In March, the Skew Index climbed toward 140 amidst the regional banking crisis. Today, however, the Skew Index is trading even higher than that—the index closed trading on Aug. 2 at about 142.
Like the VIX, the Skew Index provides insight into activity in the options markets. And as market participants get more anxious about a big, unexpected move in the market, they buy OTM options premium, which pushes up the value of the Skew Index.
One possible explanation is that investors and traders are simply expecting more volatility come fall, due to the aforementioned fact that September and October tend to be the most volatile months on the calendar. On the other hand, investors and traders may be purchasing OTM options premium to protect against recent upside gains.
In either case, it’s important to note that elevated levels in the Skew Index don’t guarantee that a big move will follow.
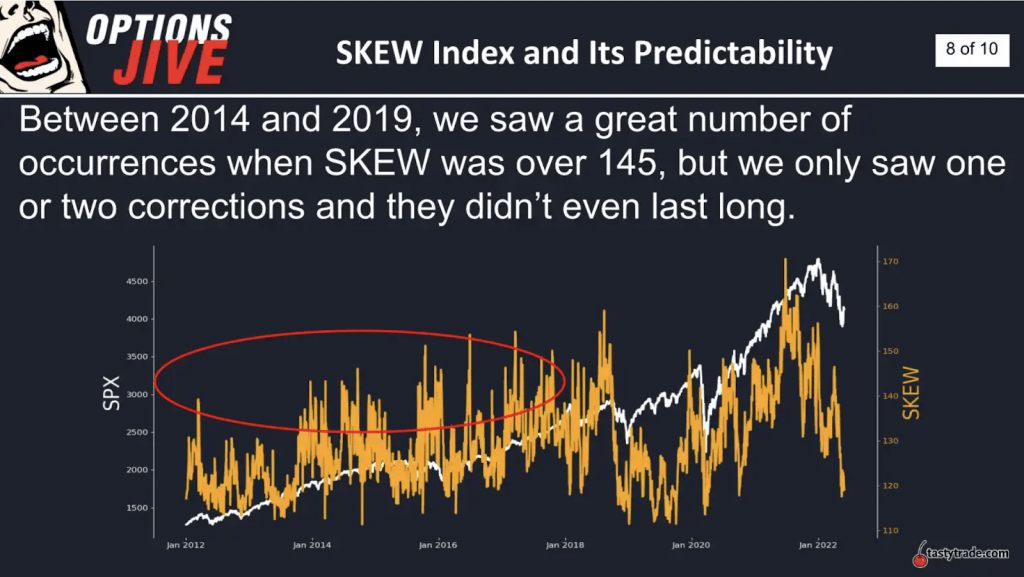
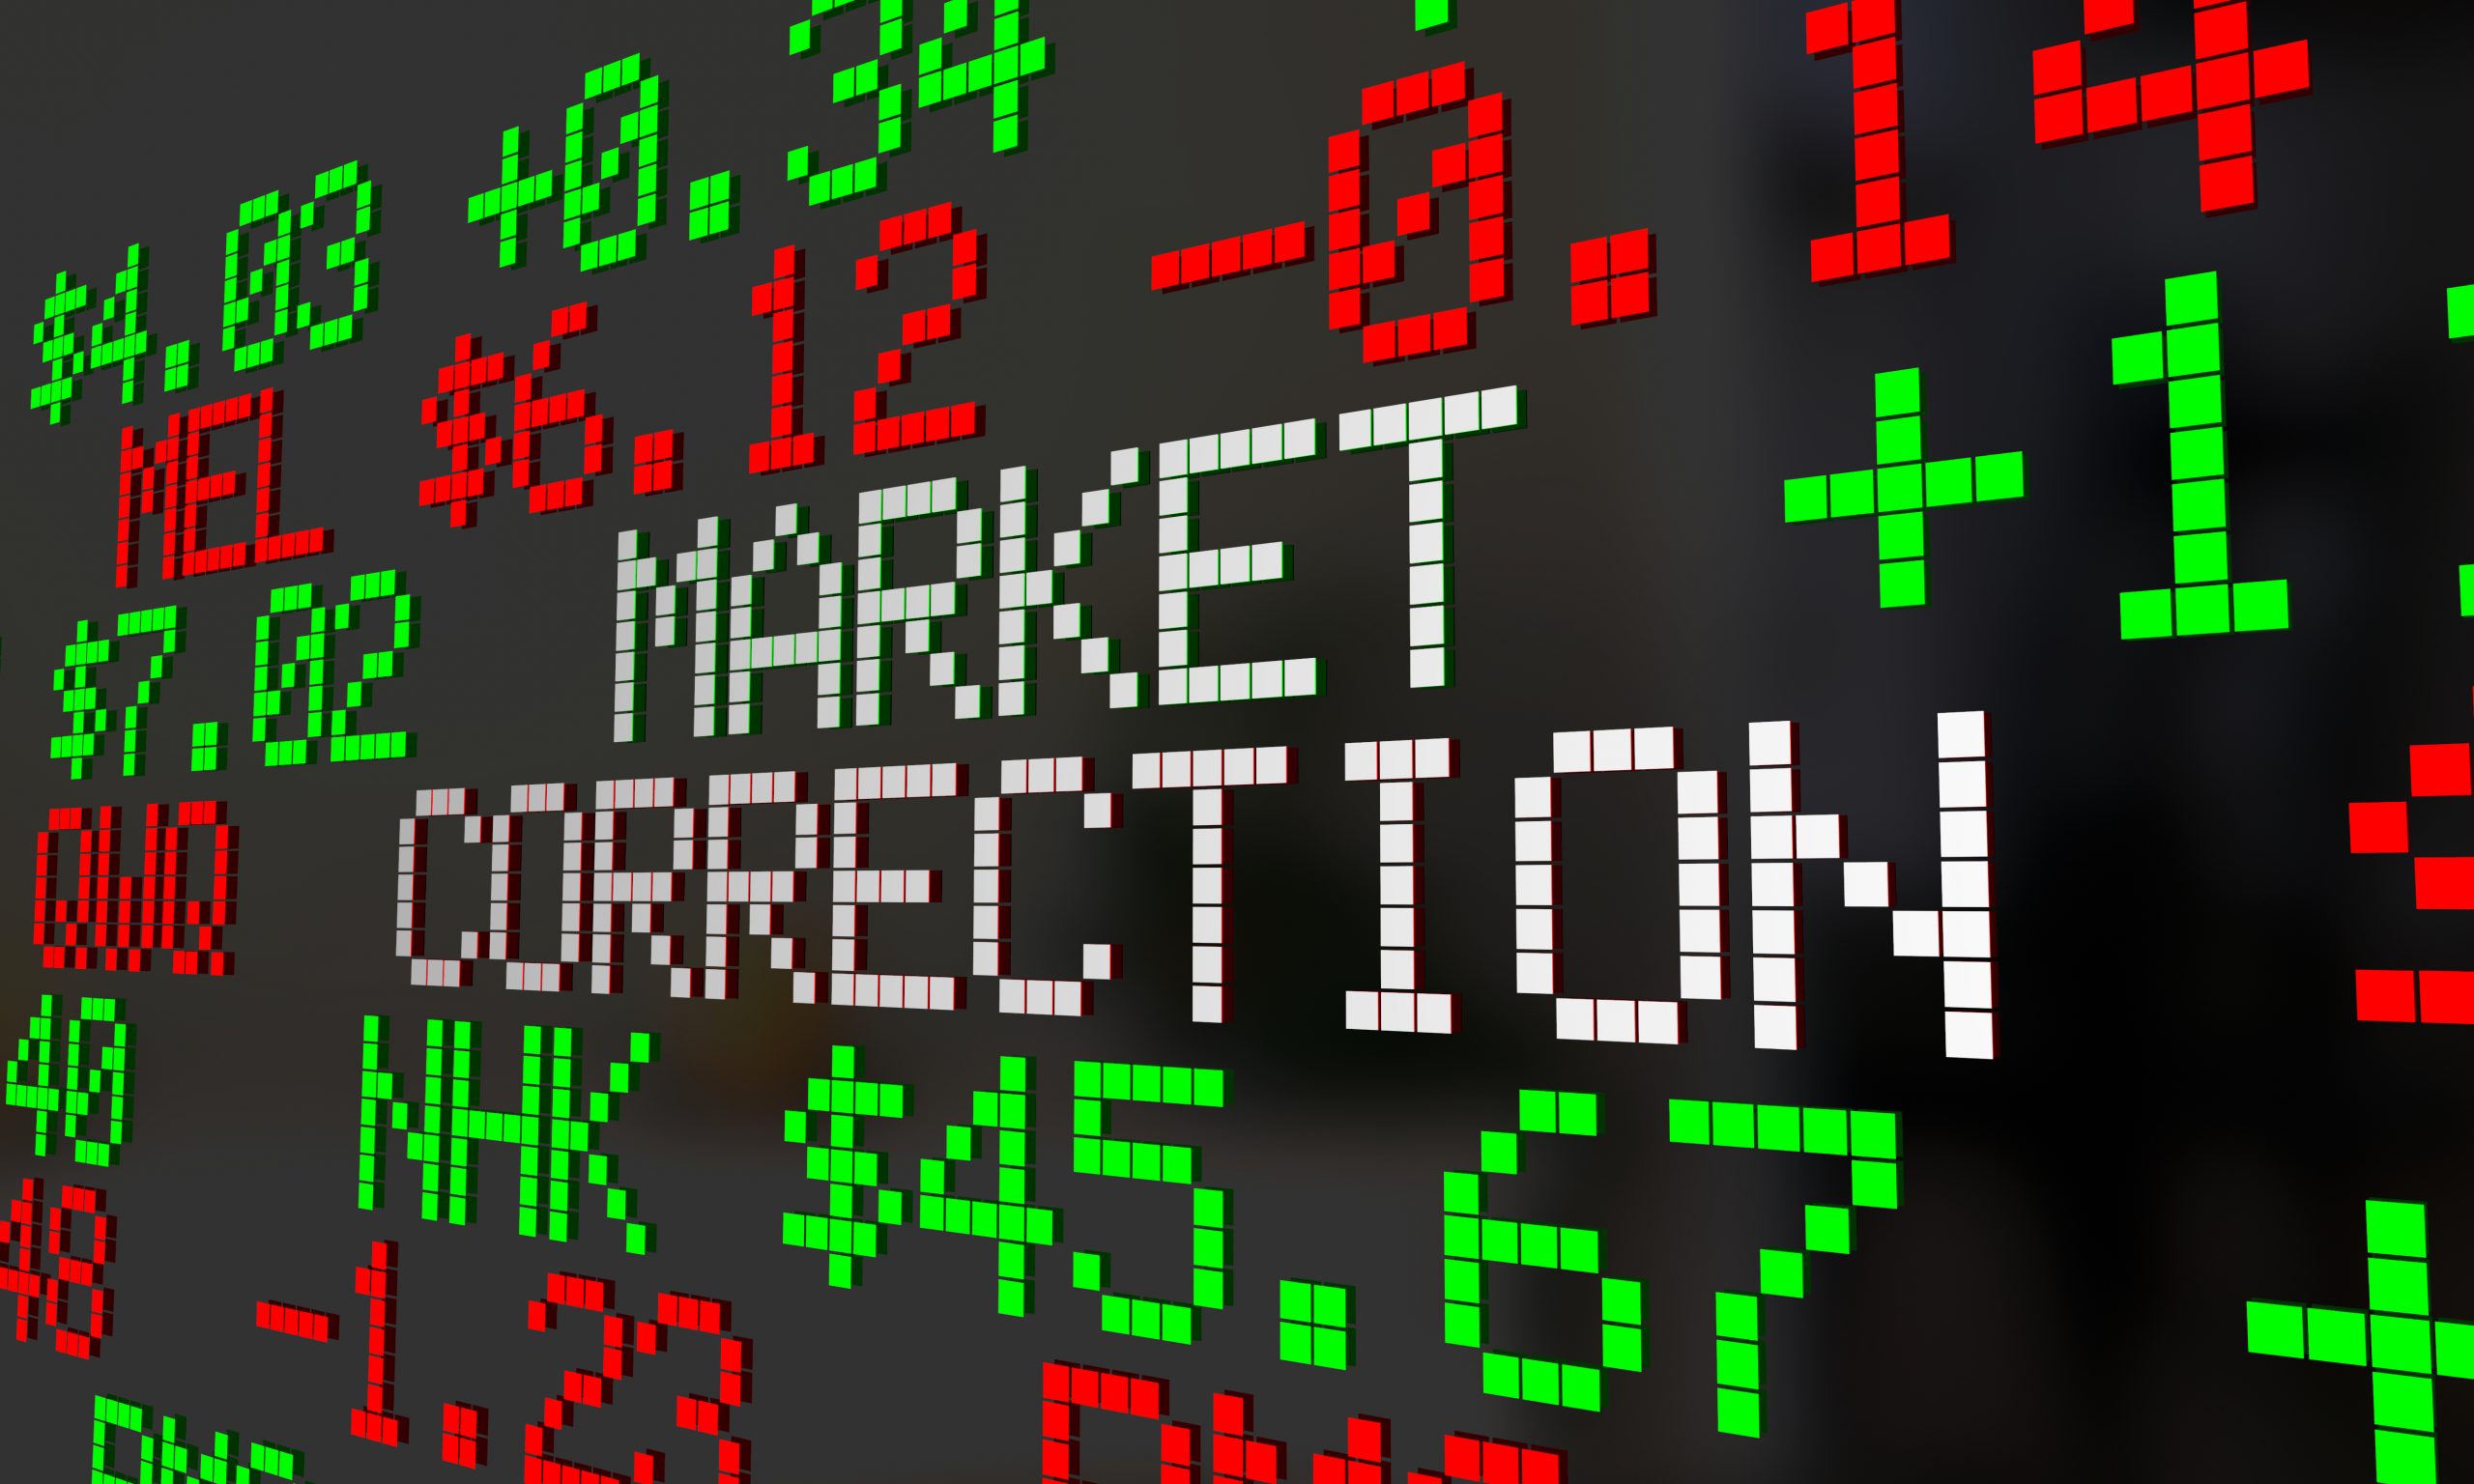
Between 2014 and 2019 there were multiple instances in which the Skew Index rallied above 140, but only a couple of those actually resulted in a significant move in the stock market—as highlighted below.
The data above illustrates that the Skew Index can’t necessarily be relied upon to accurately predict a forthcoming stock market correction. However, the index can undoubtedly serve as an indicator of prevailing risk sentiment in the stock market.
At present, the Skew Index is trading around 142. The 52-week low in the Skew Index is about 110, while the 52-week high is 158.
To learn more about the seasonality of volatility, readers can check out this installment of Market Measureson the tastylive financial network. To follow everything moving the markets, readers can also tune into tastylive—weekdays from 7 a.m. to 4 p.m. CDT.
Image generated with Midjourney.
Andrew Prochnow has more than 15 years of experience trading the global financial markets, including 10 years as a professional options trader. Andrew is a frequent contributor Luckbox Magazine.