Is the Market Expecting a Big Correction in 2022?
According to tastytrade research, big moves in the stock market tend to cluster together, and a move of 5% or more is 37 times more likely to occur after the first instance is observed.

With the 2022 trading year just getting started, investors and traders are likely asking themselves whether the stock market is due for a big correction at some point.
And while there’s no easy way to answer that question with a high probability of confidence, there are certain metrics that market participants can review to glean insight on the current risk environment.
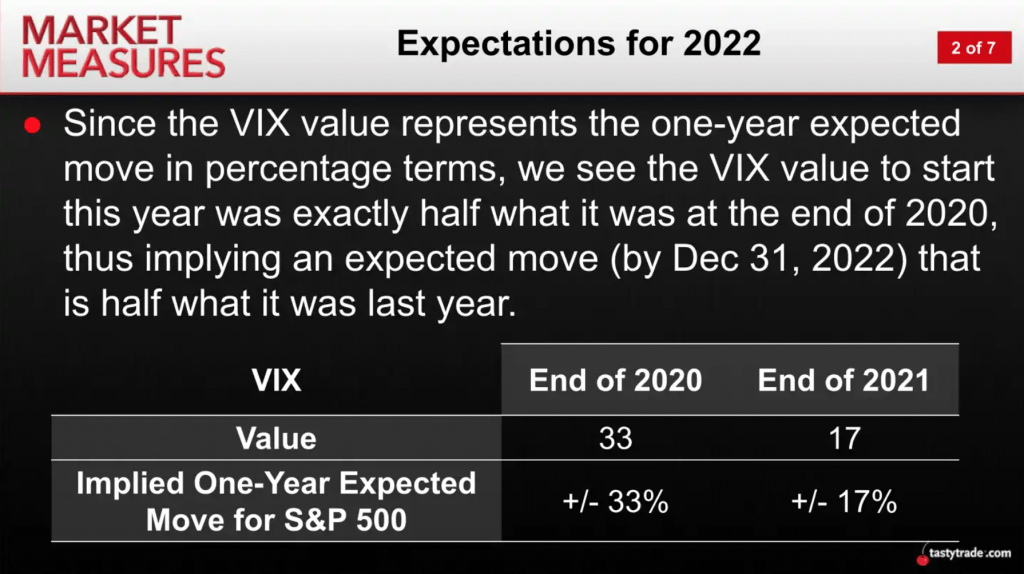
For example, the CBOE Volatility Index started the year trading around 17, which indicates the implied one-year expected move for the S&P 500 is +/- 17%. By comparison, the VIX was trading at 33 at the end of 2020—implying a one-year expected move of +/- 33% in 2021.
Last year, the S&P 500 actually increased by 29%, suggesting that the market’s expectation for 2021 wasn’t far off the mark.
But what about the likelihood of big moves on a daily basis, like the one observed on Jan. 5, 2022?
As one can see in the graphic below, daily moves of 5% or greater—typically defined as “huge moves” in an index—tend to cluster together. On the other hand, smaller magnitude daily moves (especially 1% or below) tend to be a lot more random and unpredictable.
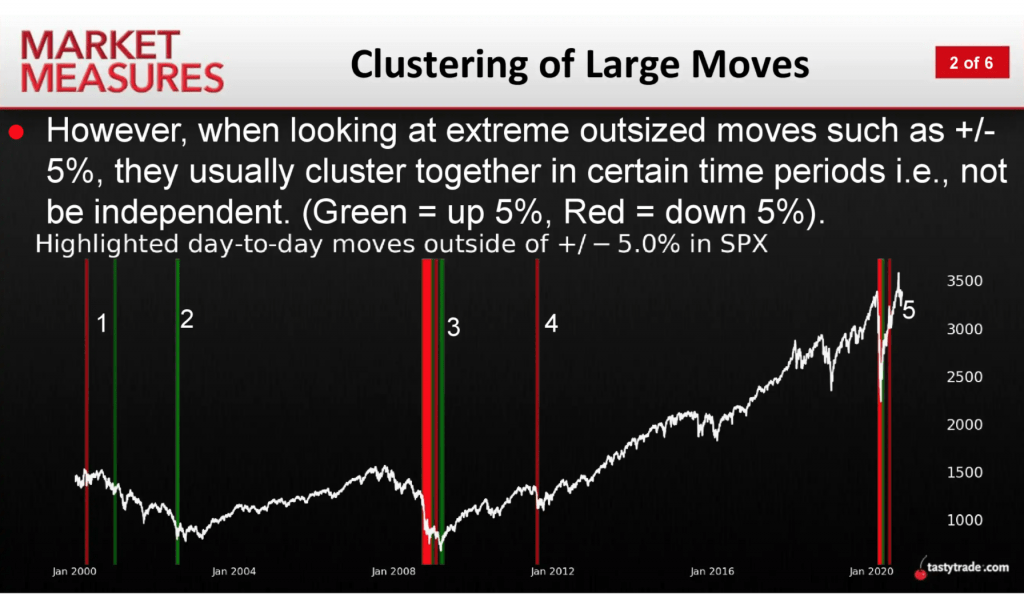
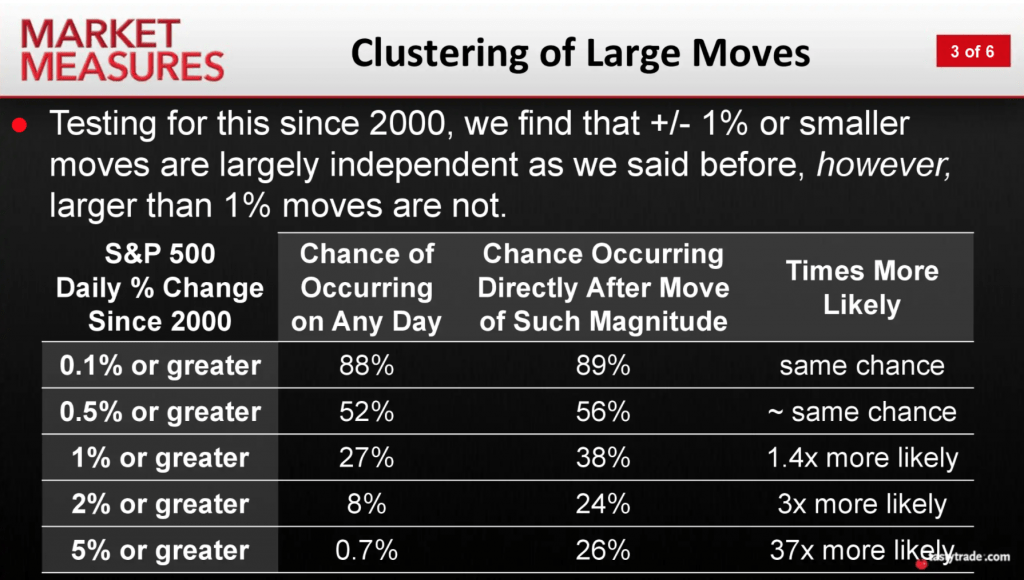
As shown in the second graphic above, the likelihood of a very large move in the financial markets (defined as >5%) on any given day is fairly small, at 0.7%. However, once a very large move has occurred, the likelihood that another extremely large move will follow it is much higher.
According to tastytrade research, a move of 5% or more is 37 times more likely to occur after the first instance has been observed.
Interestingly, this data provides further validation of previous tastytrade research focused on the VIX, or CBOE Volatility Index.
In 2019, researchers at tastytrade noticed the VIX had started moving in a more predictable manner. Specifically, the “fear gauge” was demonstrating a tendency to cluster at compressed levels before popping aggressively to the upside and then slowly reverting back toward—and below—its historical mean.
The chart below, taken from tastytrade’s Market Measures, illustrates this “cluster, pop, revert” pattern using VIX data from 2018 and 2019.
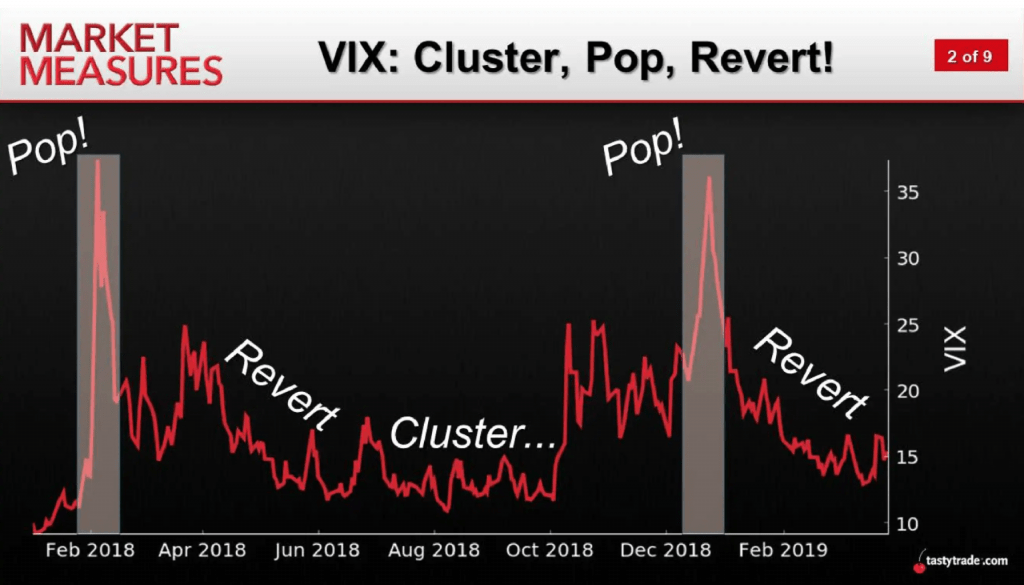
The above behavior becomes even more illuminating when one considers the newest nugget of research—that big moves in indexes (>5%) tend to cluster together. It would appear that stringing together these big moves tends to account for the “pop” in VIX. That, in turn, suggests special vigilance and adherence to risk management is advisable when big moves materialize.
A natural follow-up question is, “how long do periods of elevated volatility last?”
That’s not easy to answer because the circumstances causing market volatility aren’t always the same. However, tastytrade reviewed long-term historical data in the VIX to provide further insight on how long the VIX tends to remain above a series of thresholds (on average).
For example, as highlighted in the summarized findings below, the VIX has historically required four trading days to decline from 70 to 56 (representing a 20% drop). While a decline of 60 to 48 in the VIX has, on average, taken 23.5 trading days.
Taken together, the above means that investors and traders should pay close attention when “big moves” materialize in the marketplace. This environment will almost always be accompanied by an inflated VIX.
During these tumultuous periods, investors and traders can use the above figures as a guideline for how long the VIX might remain above a given threshold, and how long it might take for the VIX to decline further.
More big moves in the stock market during 2022 available via this link.
For updates on everything moving the markets, readers can also tune into Tastytrade Live weekdays from 7 a.m. to 4 p.m. Central Time.
Get Luckbox! Subscribe to receive 10-issues of Luckbox in print! See SUBSCRIBE or UPGRADE TO PRINT (upper right) for more info or visit getluckbox.com.
Sage Anderson is a pseudonym. He’s an experienced trader of equity derivatives and has managed volatility-based portfolios as a former prop trading firm employee. He’s not an employee of Luckbox, tastytrade or any affiliated companies. Readers can direct questions about this blog or other trading-related subjects, to support@luckboxmagazine.com.


