Natural Gas Prices Have Doubled—Now What?
Natural gas prices are up over 100% already in 2021, and some projections suggest this energy commodity could appreciate further in winter.
After climbing more than 100% in value year-to-date, natural gas is starting to turn heads in the investment community.
Natural gas prices tacked on another 5% on Monday to close trading at $5.20/MMBtu, and are now stretching toward seven-year highs.
Moreover, attention on one of the world’s most prevalent energy commodities could ramp up further in the coming weeks and months, as some analyst projections suggest that another doubling in price in the near-to-middle term isn’t out of the realm of possibility.
So how did we get here?
As with most things in the markets, it all boils down to supply and demand. And for the first time in quite a while, supplies of natural gas in the U.S. have dwindled down below their five-year average. At this time, natural gas supplies in the U.S. are roughly 7% below the average observed over the last five years.
More importantly, natural gas supplies are 17% lower than the levels observed at this time last year.
And outside the U.S., the situation has arguably gotten even more critical. In Europe, supplies of natural gas are almost 20% below five-year averages. As a result, Europeans are paying a much higher rate than Americans for natural gas—roughly four times as much, by some estimates.
Natural gas is a critical energy commodity in the world economy because it is used heavily for cooling and heating homes and businesses. The severe heat wave observed in the western U.S. this summer is a big reason that the supply-side of the market has tightened.

Looking ahead, that means that the severity of the upcoming winter will play a key role in deciding where prices go from here. Some estimates suggest that a cold winter could push natural gas prices from their current levels of $5/MMBtu, all the way up to $8/MMBtu, or even as high as $10/MMBtu.
No matter how you slice it, that would be an epic move in natural gas, considering the commodity started 2021 trading close to $2.50/MMBtu.
The rally in 2021 is especially notable because natural gas prices have been depressed for nearly a decade—spending much of the last 10 years trading below $3/MMBtu. That situation came as a direct result of the fracking-related energy boom in the U.S., which significantly increased supplies of gas in U.S. energy markets.
In Europe, prices didn’t crater to such extremes, because natural gas supplies in that region have been tight for many years. The recent completion of the Nord Stream 2 pipeline from Russia to Germany is expected to help alleviate supply constraints in the coming years, but that apparatus may not be fully operational for another four to six months, if not longer.
As a result, investors and traders in the natural gas sector would be well advised to keep a close eye on weather projections for the 2021-22 winter season. If another “polar vortex” materializes, or anything close to it, it’s highly possible natural gas prices could stretch toward the higher end of their projected range ($8-$10/MMBtu).
Alternatively, a milder winter would likely serve as a headwind to the current rally. Beyond the weather, another big factor is of course natural gas production.
The supply chain took a big hit from Hurricane Ida, with estimates indicating that up to 70% of natural gas production in the Gulf of Mexico is still offline. Further disruptions to the supply side of the equation would undoubtedly serve as additional fuel for the current rally (i.e. another big hurricane).
Importantly, investors and traders in the energy space aren’t just limited to natural gas positions, either. Crude oil has also experienced a strong bull run in 2021, and not surprisingly, the two energy commodities share a strong historical trading correlation.
One popular metric that investors and traders monitor to track the relative value of these two commodities is the Oil-to-Natural Gas ratio. As its name suggests, the price of oil is the numerator and the price of natural gas is the denominator—much like the Gold-to-Silver ratio.
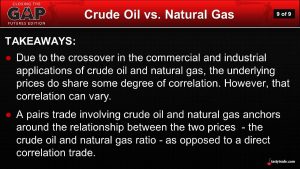
Currently, the Oil-to-Gas ratio is trading about 15, and has ranged between roughly five and 40 over the last several years. When the ratio hits an extreme—toward the lower or upper end of its historical range—traders often deploy pair trades involving crude oil and natural gas.
Opportunities for pairs may not be as attractive at this time, with the ratio trading right around its recent historical average, but investors and traders may want to keep an eye on the ratio going forward.
To learn more about trading the natural gas market, readers can review this new episode of Futures Measures on the tastytrade financial network. More context on the “seasonality” of natural gas trading is also available via this previous episode of Futures Measures.
To track and trade natural gas, investors and traders can add the following ETFs to their watchlists: United States Natural Gas Fund LP (UNG), ProShares Ultra Bloomberg Natural Gas (BOIL), United States 12-Month Natural Gas Fund LP (UNL), and iPath Series B Bloomberg Natural Gas Subindex Total Return ETN (GAZ).
For updates on everything moving the markets, TASTYTRADE LIVE—weekdays from 7 a.m. to 4 p.m. CST—is also recommended.
Sage Anderson is a pseudonym. He’s an experienced trader of equity derivatives and has managed volatility-based portfolios as a former prop trading firm employee. He’s not an employee of Luckbox, tastytrade or any affiliated companies. Readers can direct questions about this blog or other trading-related subjects, to support@luckboxmagazine.com.