October Market Crash? The October Effect Analzyed
The “October Effect” refers to an anxiety among investors and traders that the stock market will crash during the month of October, but historical data doesn’t validate this concern.

For many investors and traders the onset of October is akin to crossing paths with a black cat on Halloween—it produces an ominous feeling that one’s luck has just run out.
Black Monday, the stock market crash of 1929, the bank panic of 1907—these are just a few of the infamous stock market corrections that have all occurred during the month of October.
October’s reputation in the markets is so bad that a condition known as the “October Effect” was even coined to describe the psychological state of investors and traders at this time of year. It refers to an angst among market participants that the stock market will crash at some point during the month.
Case in point, a recent survey conducted by Allianz Life found that roughly 54% of American investors believe a stock market crash is imminent. Those findings are undoubtedly linked to the time of year in which the survey was conducted (i.e. October).
But despite all the negativity, historical data actually demonstrates that October isn’t any different than any other month—at least as it relates to stock market performance.
According to research conducted by tastytrade, the month plays virtually no role in dictating the direction of the stock market.
The image below, which summarizes the average historical market performance by month, highlights how stock market returns actually tend to be above average in October.
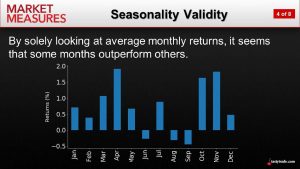
In addition to the above data, tastytrade also conducted an analysis of the standard deviation of those monthly returns. And based on those findings there was even less proof that any given month on the calendar exhibits directional bias.
So why do investors and traders fear October?
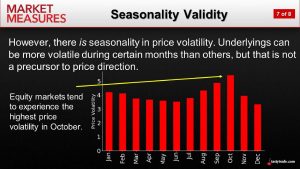
As opposed to price direction, the “October Effect” likely ties back to the fact that stock markets tend to experience a surge in volatility during the fall.
Unlike historical price returns, historical data does confirm that certain months on the calendar do appear to show a statistically significant tendency to exhibit varying levels of volatility.
A tastytrade study involving historical market data in the SPDR S&P 500 ETF (SPY) revealed that the months of September and October do tend to be the most volatile of the year. On the other end of the spectrum, May, June and December tend to be the least volatile, as highlighted in the graphic below.
The above data helps illustrate that the true origins of the “October Effect” likely stem from the tendency of the markets to experience higher magnitude moves during the fall season.
But as the historical performance data revealed, the net result of those higher magnitude moves doesn’t make the stock market any more likely to move in one direction versus the other.
The 2021 trading year actually provides a good illustration of these trends.
Since the onset of September, the stock market has seen an uptick in volatility, illustrated through higher magnitude moves in the broad market indices (both up and down). But all that volatility hasn’t resulted in horrendous market performance.
As of Oct. 8, the market is only down roughly 3.5% from the all-time highs observed at the start of September. Moreover, this same trend was observed during the 2020 trading year.
Last year, the SPY charged from roughly 257 in March of 2020 all the way to roughly 350 at the start of August. Then, during the onset of fall, volatility spiked for a brief period. But after the passing of fall, the stock market proceeded to rally through the end of the year—all the way up to 370 in SPY.
And there’s a good chance 2021 follows the same pattern.
If a complete redo of last year is in the cards, that means the broad market indices could rebound in October, and proceed to notch fresh all-time highs heading into year’s end. A trend that could reasonably lift SPY to 470 or beyond in Q4.
Regardless, subpar market performance at this time of year can’t simply be chalked up to the “October Effect.” If the stock market does finally experience a significant correction, that will be due to severe technical or fundamental factors—not just a particular day or month on the calendar.
For more information on the seasonality of volatility in the stock market—and the lack of seasonality when it comes to price direction—readers can review this recent installment of Market Measures on the tastytrade financial network.
For timely insights on everything move the markets, readers can also tune into TASTYTRADE LIVE—weekdays from 7 a.m. to 4 p.m. CST—at their convenience.
Sage Anderson is a pseudonym. He’s an experienced trader of equity derivatives and has managed volatility-based portfolios as a former prop trading firm employee. He’s not an employee of Luckbox, tastytrade or any affiliated companies. Readers can direct questions about this blog or other trading-related subjects, to support@luckboxmagazine.com.