The U.S. Housing Market is Stagnant, but many Homebuilder Stocks are Soaring
The U.S. housing market has seen minimal sales activity and reduced prices so far in 2023. But, sales of newly built homes and housing starts have rebounded, pushing the homebuilder stocks significantly higher.

The relative strength of the U.S. housing market can be an important measurement for the broader economy, which is why investors and traders follow it so closely.
Existing and potential homeowners also typically follow the housing market in order to gauge the value of their homes, and for insight into the prevailing environment for buying or selling homes.
The U.S. housing market is especially difficult to decipher right now because the data coming out of the market has been somewhat mixed.
That said, the top-line trends in the 2023 housing market suggest that prices have dipped, and that overall sales activity is below average.
Housing market sales trends
When it comes to sales in the U.S. housing market, it’s important to differentiate between existing home sales and new home sales.
Existing home sales refers to previously owned homes, which includes single-family homes, condos and co-ops. On the other hand, new home sales refers to newly built constructions of single-family homes, condos and co-ops.
Existing home sales are closely tracked because they constitute roughly 90% of annual transactions, according to the National Association of Realtors (NAR). For this reason, most U.S. housing market headlines refer to existing home sales.
That said, newly built constructions are also an important indicator in the housing market. In 2023, that’s been especially true, due to the divergence in trend between previously-owned and new home sales.
Looking at existing home sales, U.S. Census Bureau data from May 2023 showed that the number of transactions was virtually flat as compared to April 2023. In May, existing home sales in the U.S. reached 4.3 million, which was 0.2% higher than the level observed in April 2023.
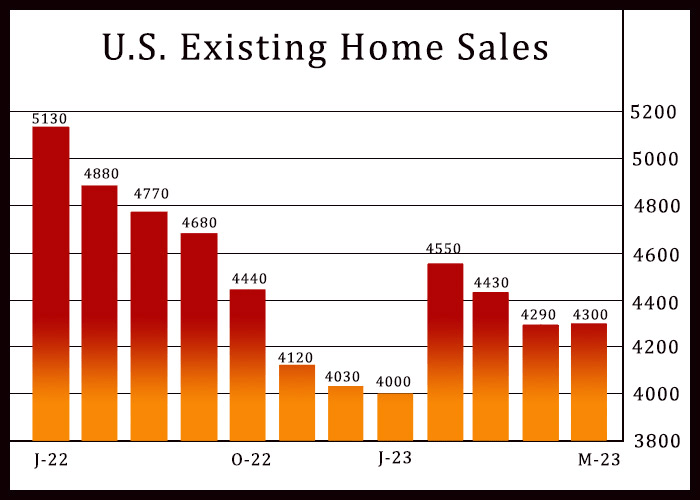
Source: RTTNews.com
Looking at existing sales data since the start of the 21st century, the monthly figure has ranged between about 3.5 million and 7 million, which indicates that the May 2023 transaction volume is closer to the bottom end of the recent range.
From this perspective, overall sales activity in the U.S. housing market is depressed at this time. However, there is one caveat to that reality—increased strength in new home sales.
In May 2023, sales of newly constructed homes jumped by 12% as compared to the month prior, according to the U.S. Census Bureau. Moreover, the May 2023 figure represented a 20% increase from May 2022.
Looking at the actual figures, new home sales were 763K in May 2023, as compared with 680K in April 2022, and 636K in May 2022. These figures reflect a positive shift in momentum, and a divergence from the existing home sales trend.
This data helps explain why the homebuilder stocks have performed so well in 2023. With six months of trading in the books, the SPDR S&P Homebuilders ETF (XHB) is already up 31%.
Rebounding sales of newly built homes also helps explain why some analysts have suggested the U.S. housing market is in recovery mode. But that characterization might be overly optimistic—at least until there’s a noticeable rebound in the sales of existing homes.
U.S. housing starts
Looking beyond sales activity, another key indicator in the U.S. housing market are housing starts.
The term housing start refers to the point at which a shovel physically enters the ground to build a new housing unit.
Housing starts have traditionally been viewed as a key economic indicator because housing starts tend to be closely correlated with the relative strength of the underlying economy.
As the economy expands, so do housing starts—and vice versa.
Interestingly, the latest housing start data also reflects a rebound in the housing market, much like the latest sales figures for newly constructed homes.
In May 2023, housing starts jumped by 21% as compared with the month prior. Last month, housing starts clocked in at 1.63 million, as compared with 1.34 million in April.
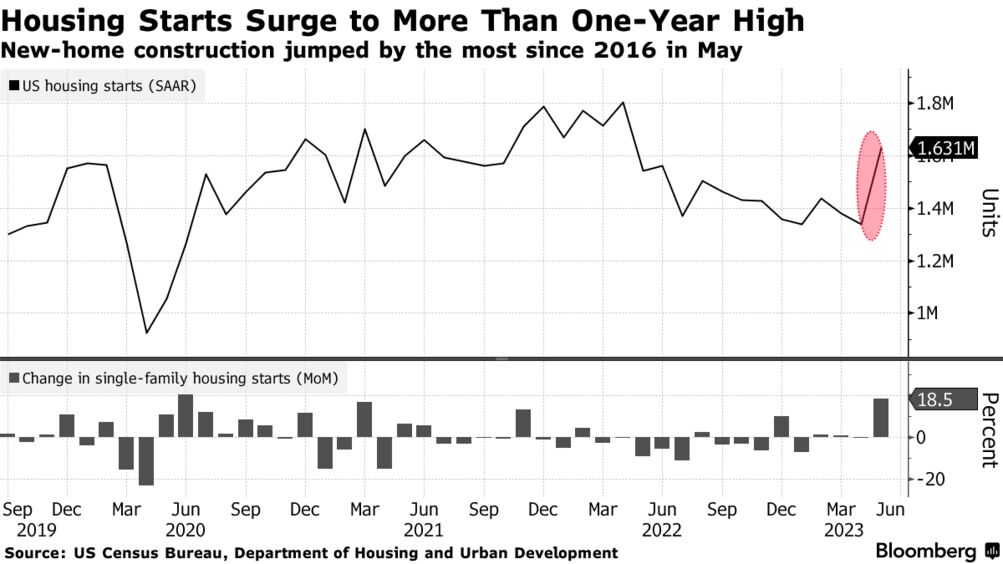
Combining this data with the aforementioned new home sales data, one can see that demand is rising in the U.S. for new inventory, as opposed to existing inventory (i.e. previously owned homes).
And one key reason for this trend within the trend is likely elevated interest rates.
The current average rate for a 30-year fixed rate mortgage is about 6.71%, which represents the highest level observed in this key indicator since 2007. However, many existing homeowners locked in much lower rates during 2020 and 2021, when the Federal Reserve dropped benchmark rates to near-zero.
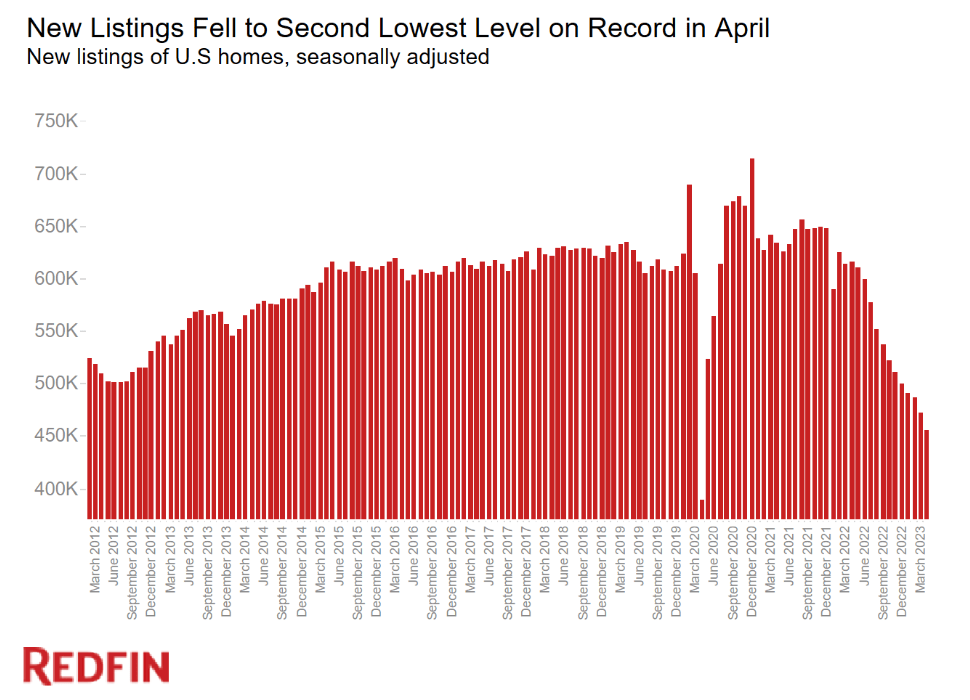
As a result, many existing homeowners are locked into attractive mortgage rates and aren’t eager to swap those loans in the current rates environment. That reality is underscored by the fact that new listings on the housing market have also been sliding in recent months.
New listings in April 2023 were the second-lowest on record since 2012, according to Redfin data.
According to Robert Reffkin, the CEO of Compass Real Estate, new listings likely won’t pick up until rates drop back below 6%. Reffkin recently told CNBC, “The issue we are seeing is that we need to have an unlock of inventory. It’s probably going to happen when mortgage rates get to 5 [or] 5.5%, at a sustainable level.”
Taken altogether, one can see why some new or potential homeowners are pivoting to newly built constructions in order to meet their housing needs. That’s also likely why sales of newly constructed homes and new housing starts are seeing an uptick in activity.
That trend within the trend certainty represents a bright spot for the broader housing market, which as noted previously, has been characterized by declining activity.
Housing valuations in 2023
Looking beyond sales and housing starts, other key indicators for the housing market are prices and valuations.
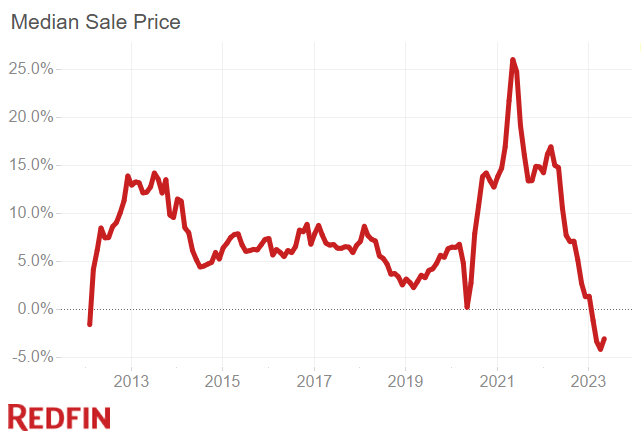
One of the most common ways to track housing prices in the U.S. is through the median sales price. This statistic can be broken down by all transactions, or by new home transactions.
Since fall of 2022, both of these statistics have exhibited a steady—though far from precipitous—decline.
Looking at the entirety of the housing market, transactional data shows that the median price for a house in the U.S. peaked at roughly $479,000 last year. Since then, the median sales price has dropped to roughly $436,000, according to data compiled by the Federal Reserve.
The median price for new homes has also been tracking lower. Last October, the median sales price for a new home peaked at roughly $495,000, but has since dropped to around $420,000, according to Census Bureau data.
For existing homeowners, those declines aren’t necessarily welcoming news. On the other hand, potential homebuyers have undoubtedly been buoyed by the recent reversal in trend.
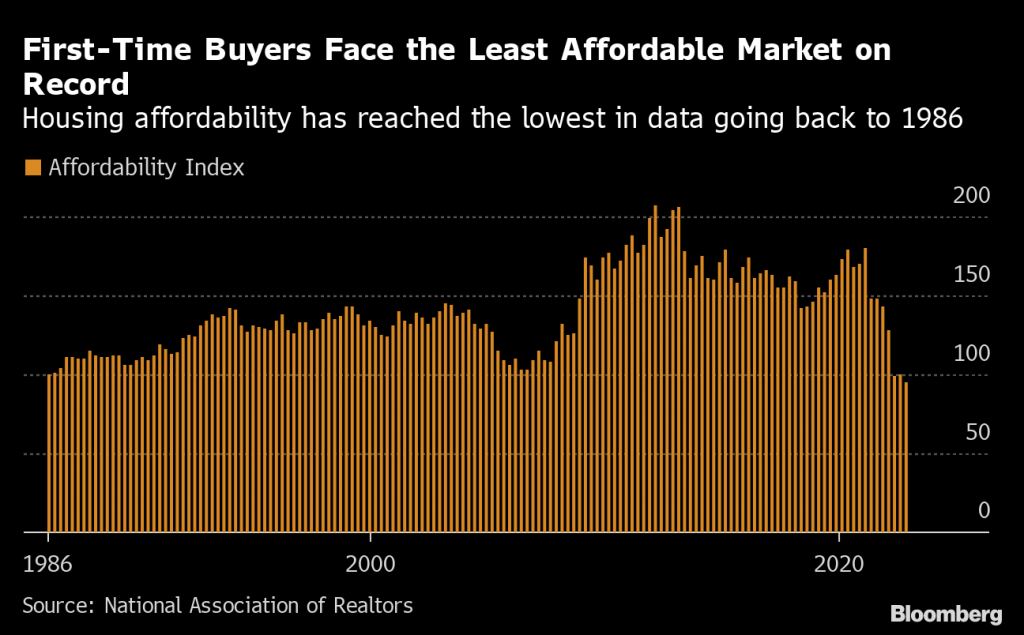
Affordability in the U.S. housing market has been a key challenge for a long time now, and the post-pandemic environment has been stifling for new homeowners. As illustrated below, the Affordability Index suggests that homebuyers haven’t had it this bad since the 1980s.
According to ATTOM—a real estate-focused data company—monthly homeownership expenses now require about 33% of family income (on average), which is the highest since 2007. Interestingly, that was also the last time that interest rates were this high.
ATTOM noted in its recent report that lenders prefer that figure to max out at 28%, which illustrates that current levels of debt-to-income have likely put many existing homeowners under financial stress.
The challenges associated with affordability have been so severe that they’ve even kicked off a new trend within the current housing market.
According to the National Association of Realtors, buyers have been expanding the scope of their home searches, and are now moving a median value of 50 miles from their old home. Previously, the median value for such moves was closer to 15 miles.
Parting shots
The 2023 U.S. housing market has been characterized by a slowdown in sales activity and a moderate pullback in prices.
However, newly released data from May 2023 indicates that new home sales activity and new housing starts are starting to rebound.
The big question is whether those positive trends are due to a meaningful uptick in buyer sentiment, or if they have emerged because the available supply of existing homes is at record lows.
Going forward, strength in the U.S. housing market will undoubtedly hinge on the actions of the Federal Reserve, as well as the health of the underlying economy. If the Fed raises rates further in 2023, that could weigh on both sales activity and prices.
But if the Fed were to ease up, that could trigger a rebound in sales in the most significant portion of the housing market: previously-owned homes. And that could help reverse the recent decline in median sales prices.
The next major policy meeting of the Federal Reserve is scheduled for July 25-26, 2023.
To track and trade the U.S. housing market, add the following single-stocks and ETFs to their watchlists:
- D.R. Horton (DHI), +32%
- Home Depot (HD), -2%
- iShares Residential Multisector Real Estate ETF (REZ), +9%
- iShares Core U.S. REIT ETF (USRT), +5%
- KB Home (KBH), +60%
- Lennar Corporation (LEN), +36%
- LGI Homes (LGIH), +39%
- Lowe’s Companies (LOW), +34%
- NVR (NVR), +36%
- PulteGroup (PHM), 67%
- Real Estate Select Sector SPDR Fund (XLRE), +2%
- Redfin Corporation (RDFN), +210%
- Schwab US REIT ETF (SCHH), +2%
- SPDR S&P Homebuilders ETF (XHB), +31%
- Toll Brothers (TOL), +56%
- Vanguard Real Estate ETF (VNQ), +2%
To follow everything moving the markets in 2023, tune into tastylive—weekdays from 7 a.m. to 4 p.m. CDT.
Andrew Prochnow has more than 15 years of experience trading the global financial markets, including 10 years as a professional options trader. Andrew is a frequent contributor Luckbox Magazine.