Asymmetric Leverage, Plus the Current IV & IVR Landscape
Asymmetric Leverage
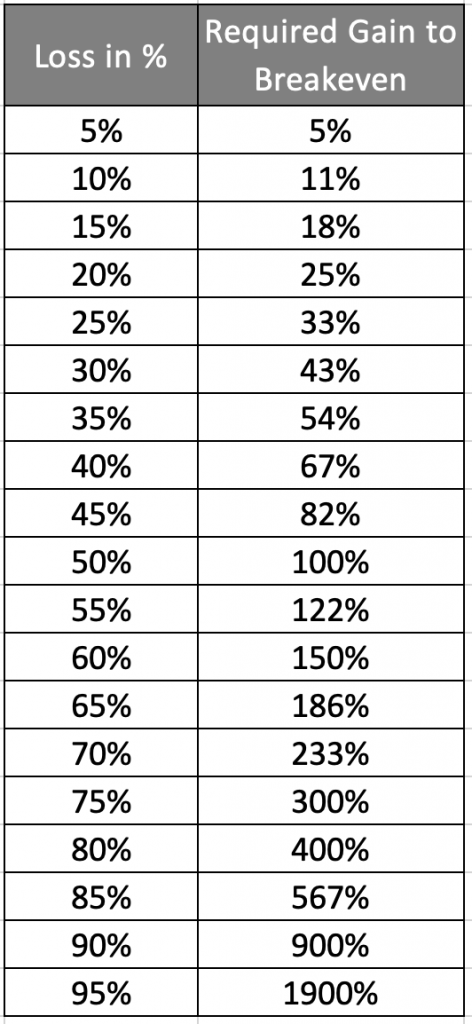
If you lose 50% in a trade, you’ll need a 100% return on the next trade, just to breakeven. Here is the math: Required Gain to Breakeven = 1 / (1-loss in %) – 1
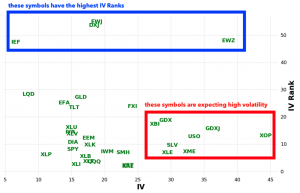
This is one of our favorite visualizations. It is plotting IV (x-axis) against IV Rank (y-axis).
Translation:
Top Left = When comparing them to other stocks, these symbols don’t move much. However, compared to the last year volatility, these stocks are moving a relatively large amount
Bottom Left = When comparing them to other stocks, these symbols don’t move much. And compared to the last year volatility, these stocks are moving aren’t expected to either
Top Right = Ideal zone for premium sellers. When comparing them to other stocks, these symbols move a lot. And compared to the last year volatility, these stocks are moving a relatively large amount
Bottom Right = When comparing them to other stocks, these symbols move a lot. And compared to the last year volatility, these stocks are moving aren’t expected to either

The free weekly Cherry Picks newsletter from tastytrade is stuffed with market research studies, data-driven trade ideas, and unique insights from the geekiest of geeks. Conquer the market with confidence … get Cherry Picks today!
Cherry Picks is written in collaboration with Michael Rechenthin, PhD, Head of Research and Development at tastytrade; James Blakeway, CEO of Quiet Foundation, a data science-driven subsidiary of tastytrade; and Eddie Rajcevic, a researcher for the tastytrade network.