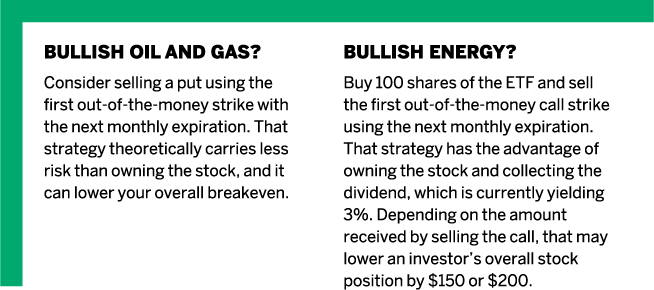
Two Timely Energy Trades
Sector volatility projections
ETFs have become popular among investors, partly because of their low cost and because they enable investors to participate in a large number of stocks in a single transaction. The ETF with the largest daily volumes traded is the S&P 500 ETF (SPY). An average of 110 million shares are traded per day, which amounts to more than $28 billion a day – a serious amount of liquidity.
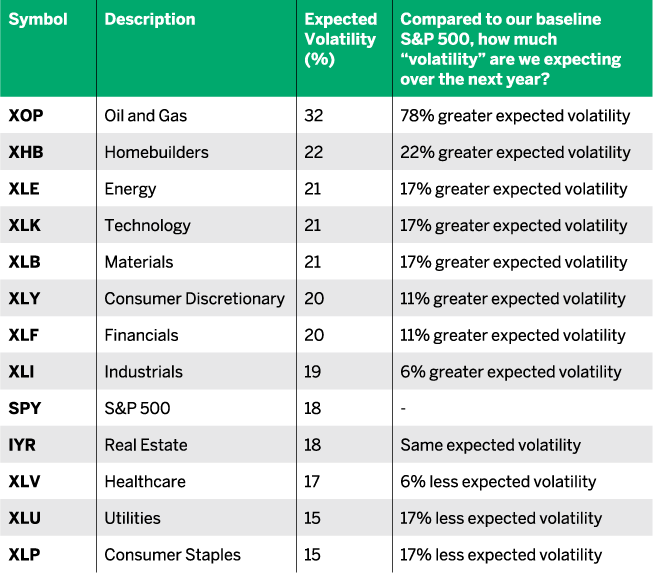
Below, we’ve listed a few favorite sector ETFs, along with the expected volatility of each. To help keep things relevant, we’ve made comparisons to the S&P 500.
Expected volatility – formally known as implied volatility – is calculated from option prices and represents the amount of movement that can reasonably be expected. In other words, the higher an ETF’s option price, the greater the expectation of movement. The lower the price of an option, the less it is expected to move. The farthest righthand column compares the expected volatility of the S&P 500 to various sector ETFs. This is accomplished by dividing the expected volatility of the ETF by the expected volatility of the S&P 500. The result shows how much greater or less the expected volatility is for ETFs relative to the broader market.
How can investors use this information? First, they should become familiar with ETFs they own and how much they might move. Investors with exposure in the oil and natural gas sector shouldn’t be surprised if those stocks move 50% more than the S&P 500 during the next year. So, if the S&P 500 moves by 10%, XOP might move 15%. Second, they can take advantage of high volatility. Covered calls and short puts are two strategies that can rein in that excess volatility.
Sector ETFs
Expected volatility is calculated from option prices and represents the amount of movement that can reasonably be expected.
Michael Rechenthin, Ph.D., (aka “Dr. Data”) is head of research and data science at tastytrade.