Markets and Midterm Elections
Stock prices used to surge after off-year voting, but the Fed’s adjustments to the economy may have changed that
A lot of investors are convinced that a four-year U.S. presidential cycle governs some of the ups and downs of stock and options prices. They say it happens because presidents institute market-friendly policies in the third year of their terms to boost the economy and hold onto office for themselves or their party.
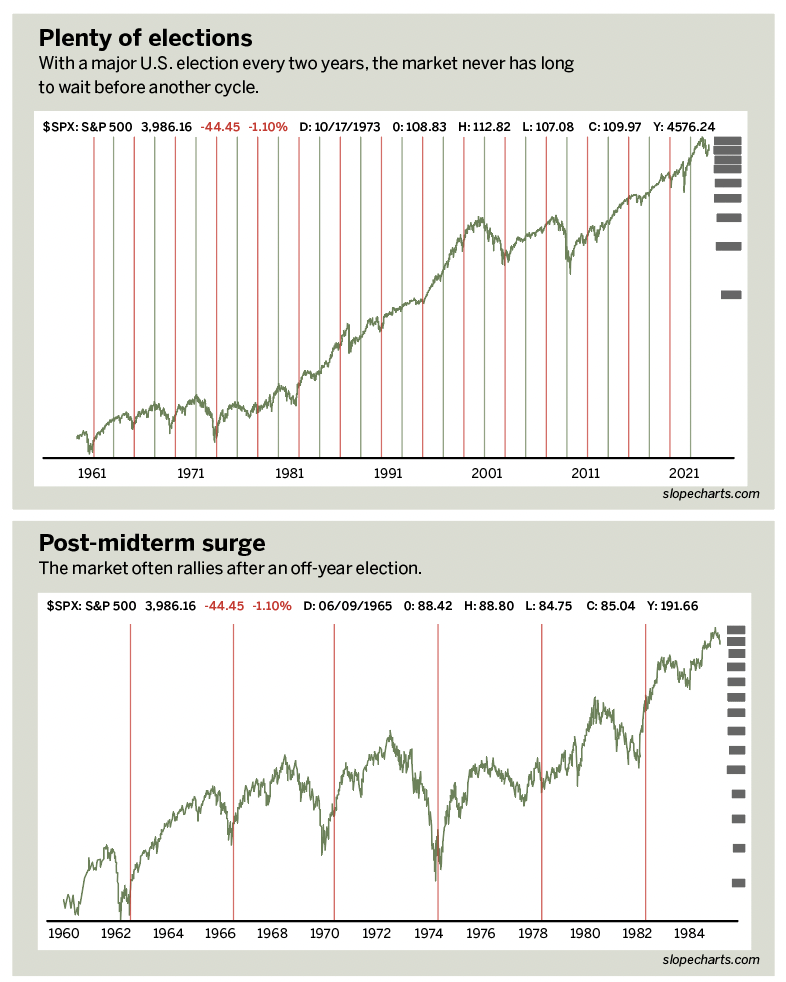
To show the idea has merit, let’s view stock prices from a long-term perspective. The first figure shows the past 70 years of price fluctuation in the stock market, as represented by the S&P 500 cash index (SPX).
Horizontal lines representing election years are overlaid on the chart, the blue ones indicate presidential elections and the red ones mark midterm elections.
At first, the lines might seem like little more than noise, but examining the sections they demarcate can yield interesting ideas.
Powerhouse post midterms
When only the red lines are displayed, it’s clear the stock market tends to rally for many months following the midterm elections.
That trend aligns nicely with the theory that the third year of a presidential election cycle is the strongest.
In fact, the strength of the stock market on the heels of midterms is nothing short of remarkable. This chart highlights the elections from the 1960s, 1970s and 1980s for reasons we’ll examine shortly.
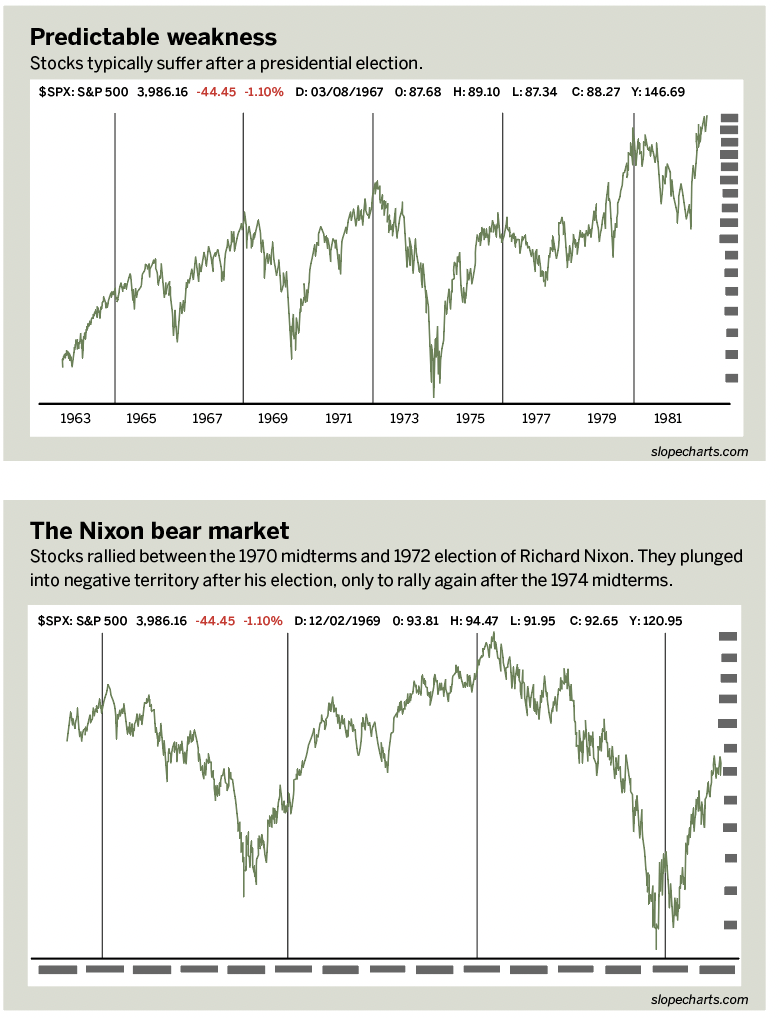
Post-election hangovers
The period following presidential elections is extraordinarily weak. Perhaps one reason is the party in power throws everything it’s got—colloquially speaking—at the market in a last-ditch effort to maximize its chances at retaining power.
Once the election is over, the political party in question has not only “spent” its political capital to improve the economy and the stock market, but it also instantly loses its main incentive to do so. In other words, there isn’t a point in trying to “feed” a market in the short-term once the election has already passed.
The line chart of the S&P 500 following the horizontal blue lines shows the stock market has often been tremendously weak almost instantly after presidential elections.
A nearly perfect example
Zooming in on a perfect example of these events, take a look at the period from the late 1960s through the mid-1970s. As can be seen in the chart:
• Following the 1968 election, there was an extremely strong bear market
• Before and after the 1970 midterm election, the market was quite strong
• In 1972, only weeks after Richard Nixon was elected president in one of the largest landslides in United States history, the stock market commenced one of its worst bear markets on record
• In the wake of the 1974 midterm elections, the two-year bear market ended and a very powerful rally began
Thus, with clockwork precision, this “midterm-up, presidential-down” phenomenon played out beautifully.
Inorganic modernity
The examples highlighted have been from an era preceding the modern age of finance. The reason is that in the 1960s, 1970s and 1980s, the accommodations by the Federal Reserve were much smaller than in recent decades.
By way of example, this chart shows the presidential elections over the past decade. As is plain to see, the election might as well have not been held as far as the stock market was concerned. There wasn’t even the tiniest “blip.”
Instead, the market more or less went resolutely higher, not concerning itself with political parties or actions.
Why would such a tremendous change take place? After all, for decades it seemed that the elections had profound and quite predictable effects on the equity markets.
It seems most likely the Federal Reserve’s injection of trillions of dollars into the stock market has had a “smoothing-over” effect. Elections and politics are still very real, and the effects of the policies from the political parties still have economic import. Recent election dates, however, seem to have virtually no meaningful influence on direction.
It will thus be interesting to see how the markets react to the the 2022 midterms. If the long-term reaction takes place, as seen from 1960-1980, stocks will probably exhibit meaningful strength in the weeks and months that follow.
On the other hand, if the market continues to drift listlessly in whatever direction it had been going before the midterms, it may well be that the Fed’s influence is so great that the election cycles are a relic of a bygone era.
Tim Knight has used technical analysis to trade the equity and options markets for decades. He founded Prophet Financial Systems and created the website Slope Charts which offers free access to his charting platform. @slopeofhope