Technical Analysis Makes the Grade
Are you inclined to question the merits of technical stock analysis? Then consider this history lesson.
Early in 2021, Luckbox examined the charts of public companies in the education sector in an article called Seven Smart Stocks. Let’s look at how those stocks have fared in the intervening 18 months and see what lessons investors can learn.
The paragraphs in italics hearken back to observations from the original article, while the passages in regular type carry current commentary.
Strategic Education Inc. (STRA) had survived some hard times by early 2021, and its stock had begun climbing but not to its former highs. The chart looked vulnerable because the recently completed topping pattern resembled a sequence from 2007-2011 that preceded a severe decrease in share prices.
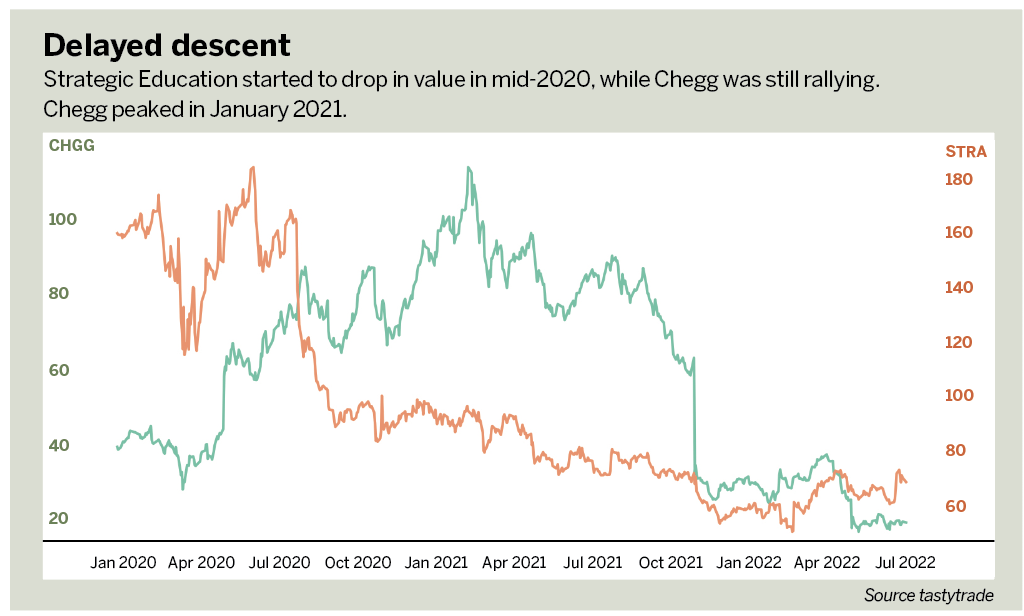
It was vulnerable indeed and lost 30% of its value. The stock does not have significant support on the chart until approximately the $35 to $40 range, where there’s a substantial block of ownership.
GP Strategies (GPX) had increased in price slightly in early 2021, but its chart had been creating lower highs and lower lows—the very definition of a downtrend— for more than half a decade. It seemed that buying would be overmatched by owners liquidating, creating selling pressure from the overhead supply that resulted when the stock was trading in the 20s and 30s.
This case differs from the other six. It’s the only stock that increased in price, rising 75% in a matter of months thanks to a buyout by the London-based firm Learning Technology Group (LTG.LSE). Note that since early 2021, the new parent company decreased 35%.
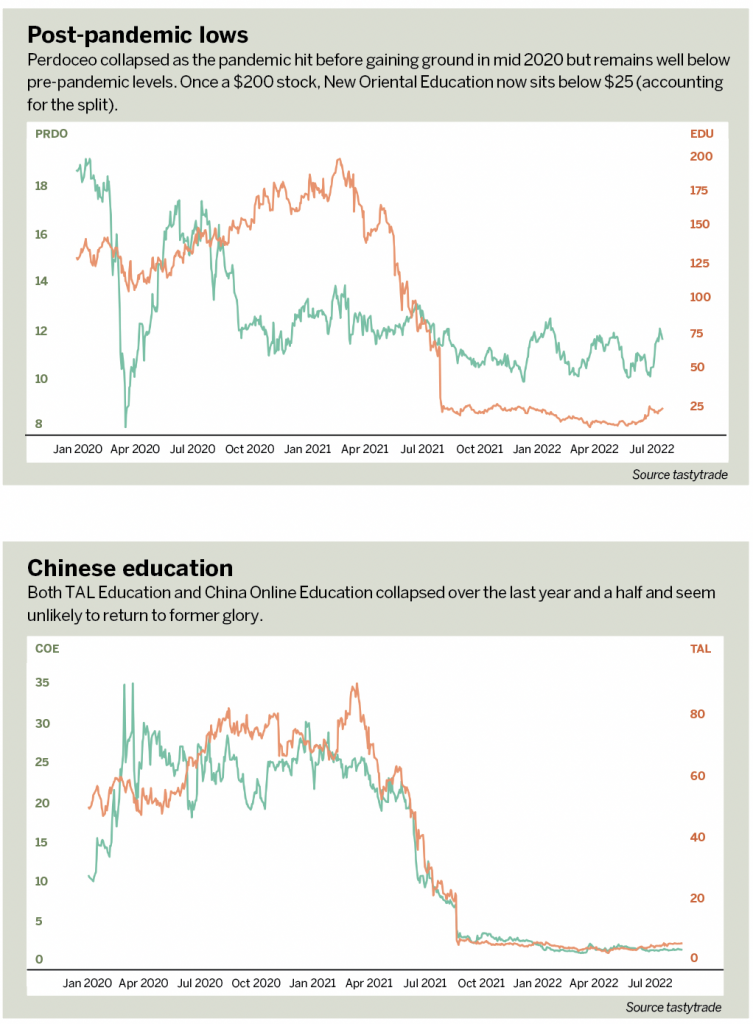
Luckbox reported in early 2021 that Perdoceo Education (PRDO) had closed quite a few of its brick-and-mortar campuses. A topping pattern was first found spanning 2008-2011, which preceded an enormous drop in equity value. The more recent topping pattern might presage a similar decline in price. The chart looked vulnerable.
This security did fall in price, but its 19% decline represents a solid performance compared with peers. For having such a well-formed topping pattern, the stock has meandered aimlessly for two years, suggesting it’s far less vulnerable than the original pattern suggested.
Luckbox said in early 2021 that Chegg (CHGG) had been doing remarkably well since early 2016, when it climbed about 20-fold. Even in 2020, the stock tripled from March through August. But the trend line broke in August 2019, and what had been support had become resistance. Still, it continued to climb robustly. Luckbox noted, however, that the purpose of the reliable trend line had changed and its cleanness had ended.
Chegg, the only U.S. firm profiled here that fell as precipitously as the Chinese companies, has lost 80% of its price. The stock peaked in February 2021, at above $100 but began a downtrend that persists to this day. The most severe shock to the stock took place in November 2021, with an enormous gap lower in price.
China Online Education (COE) didn’t have a long history as a publicly traded entity, but its saucer pattern was relatively well-formed in early 2021 and featured growth in trading volume. The stock was near its lifetime highs, and a clean break above this saucer suggested higher prices ahead.
From a charting perspective, this stock is especially interesting. The “well-formed” saucer had the markings of a bullish breakout—if and only if it broke above the saucer itself. That didn’t transpire. Instead, the price languished near the top of the saucer and slowly began breaking down. The breakdown picked up speed in spring 2021, and since then, the stock has suffered a staggering 96% drop, at one point even reaching “penny stock” status.
Luckbox observed in early 2021 that over the past eight years, stock in TAL Education Group (TAL) increased 8,000% in a steady, unrelenting climb. TAL had pushed higher, month after month, year after year, with no meaningful downturn. Even the strongest bear markets hadn’t broken the uptrend.
The stock’s chart peaked in February 2021 as it approached $100. Since then, it has plunged to depths where a share would not even buy a cup of coffee. By March 2022, it was trading at levels last seen a dozen years ago, wiping out the progress it made since coming to the public markets.
Although the stock price of New Oriental Education (EDU) was not as calm and steady as TAL in early 2021, the trend was obviously up. What made it intriguing was the increasing sharpness of the uptrend. Normally, stocks diminish in energy, but this one seemed to accelerate its ascent.
This stock peaked in February 2021 before losing virtually all its value, wiping out 15 years of price gains and matching price levels witnessed in 2007. The 92% drop since the original article illustrates how universal the plunge in Chinese education stocks has been.
China flunks out
With the exception of GP Strategies, which would probably be showing a loss had it not been for a corporate takeover, all of these stocks dropped in price, some of them spectacularly.
So, the lesson from this examination of before-and-after performance is that it’s vital to examine charts continuously. Don’t just scrutinize a stock chart, make a decision, place a trade and forget about it.
As Luckboxsaid in the original article: Back in 2014, any equity analyst would probably look grimly at the for-profit education sector, but the apex of the public rancor against this sector was actually the nadir of those stock prices. The public markets seem to be showing the most enthusiasm for Chinese-based companies. This is a trend that is likely to continue in 2021.
After taking a position in a stock, tirelessly monitor its progress or decline. That doesn’t mean tick by tick, but review stock charts and ask whether an investor would want to own this stock now.
In each example, warning signs flashed long before severe price drops. The charts would have warned the observant investor before these eye-watering losses had a chance to harm a portfolio. Based on present
conditions, it could take years for education companies like these to have healthy capital markets again.
Tim Knight has used technical analysis to trade the equity and options markets for decades. He founded Prophet Financial Systems and created the website Slope Charts which offers free access to his charting platform. @slopeofhope