Three Stocks Coming Up Short
Stocks are decoupling, and this troika of equities appears to be headed lower
Of the many changes that shook the stock market in 2022, perhaps the biggest was that it was allowed to become a market again.
It happened when the Federal Reserve stepped away from “accommodation”—the policy of keeping interest rates low to spur economic growth and keep unemployment low.
In abandoning that approach, the Fed also caused the high correlation among all asset classes to fall away. That made it more of a stock picker’s market than it had been in years.
Some sectors were weak, some were strong and some were in between. But the point is that instead of everything moving together in the same direction, individual stocks began to take on personalities again. In turn, they became much more amenable to examination with classic technical analysis.
Large movers
Let’s review three trades that share common characteristics:
•
The stocks are nominally expensive. In other words, they’re not $3 stocks but aren’t in the high double digits or the triple digits—with plenty of room to fall.
•
They are, in a fundamental sense, very richly valued.
•
They have an extremely large and well-formed top, suggesting a substantial price drop in 2023.
A simple short-sale would be one way to go about this, but buying long-dated puts would have much greater potential for percentage gains.
Note that all three stocks already had tremendous price drops since their peaks. Some might interpret that to mean the stocks are “on sale” or don’t have much more room to fall.
What these charts suggest is that the stocks aren’t bargains. They have the potential to turn an already substantial fall in price into a cataclysmic one. They just need enough time to erode—which depends largely on the direction of the stock market in general.
MongoDB (MDB)
MongoDB was founded in 2007 and had its initial public offering in October 2017. In its first four years as a public company, it was an exceptional performer, rising literally thousands of percentage points in price.
From 2020 to 2022, however, an enormous topping pattern formed, with the high price at about $585 and the base of the pattern at about $213, suggesting a spread of $372. For a stock priced at about $150 in late 2022, a topping pattern with a $372 price range is staggering.
The company has no price-to-earnings (P/E) ratio, because it has no earnings. Instead, the company presently loses hundreds of millions of dollars each year.
Between the lifetime low of $24.62 (which was not long after its initial public offering) and recent price levels, there’s little in the way of meaningful price support.
So, unless the company’s fundamentals improve radically, it’s possible this stock will continue “bleeding out” to lower prices, especially if the market in general remains weak.
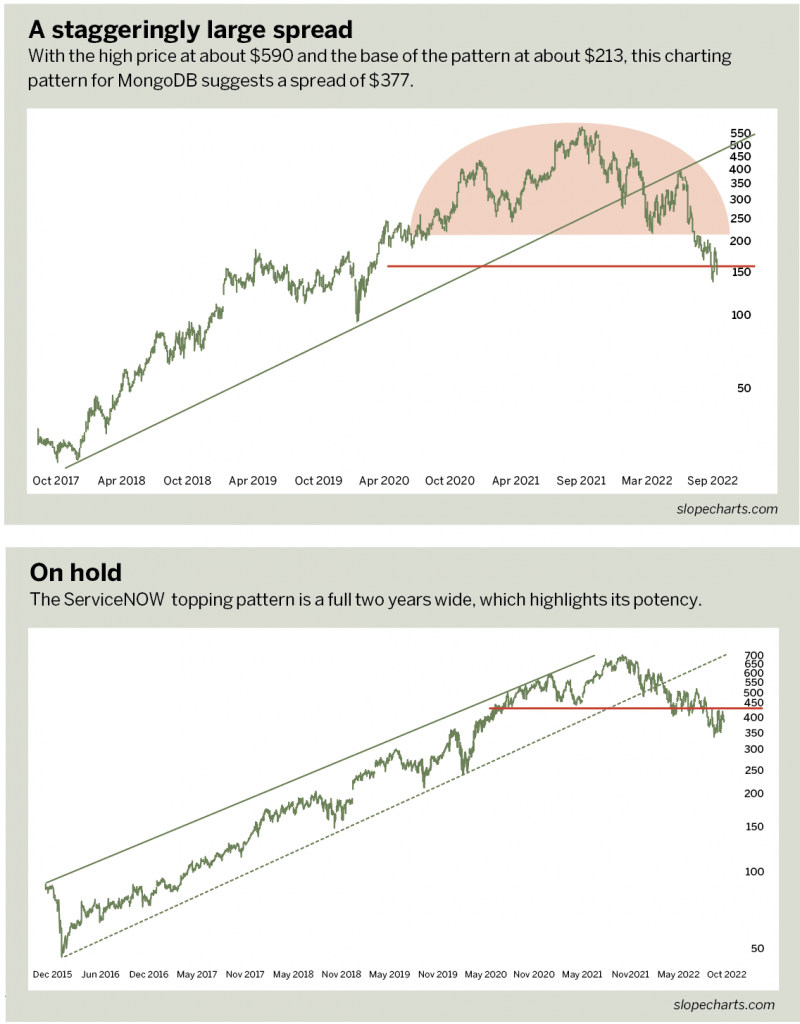
ServiceNow (NOW)
ServiceNOW was founded in 2003 to develop what the company calls “a cloud computing platform to help companies manage digital workflows for enterprise operations.” (Whatever that means).
Although the company is profitable, its P/E ratio is an eye-popping 403. As with MongoDB, ServiceNOW had an absolutely astonishing run-up in price, rising nearly 30-fold in eight years.
Yet, also like MongoDB, ServiceNOW has hammered out a tremendous topping pattern with a base at about $434 and a peak of about $708, indicating a price spread of about $274.
The topping pattern, also similar to MongoDB’s, is a full two years wide. It’s very large vertically (with respect to price) as well as horizontally (time).
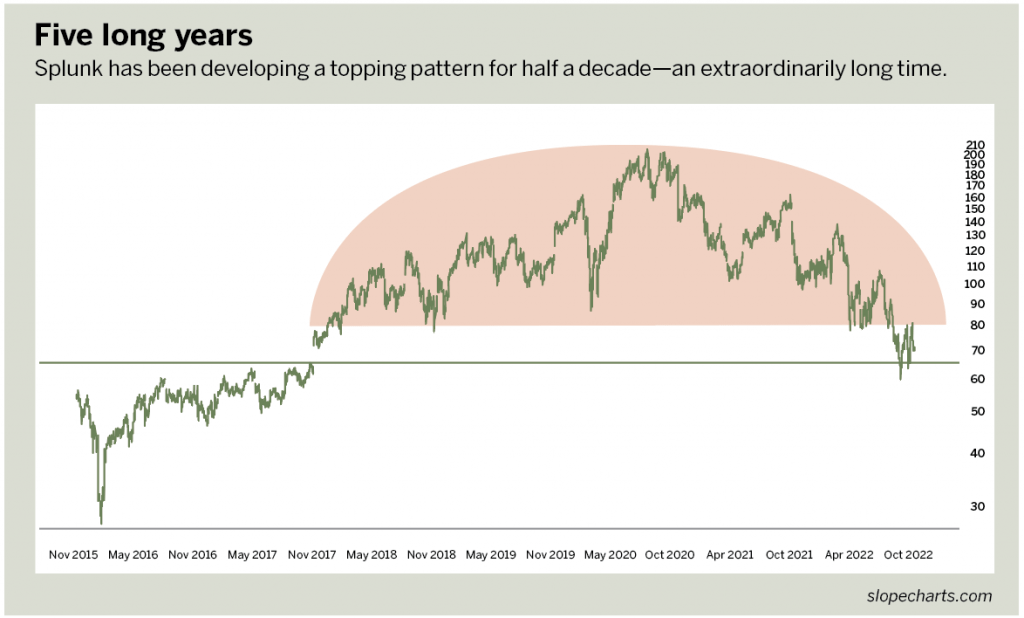
Splunk (SPLK)
The third trade idea centers on Splunk, yet another cloud-based high-tech firm. Like MongoDB, it has no “E” (earnings) with which to calculate a P/E.
Indeed, the losses at this organization are measured not in the hundreds of millions of dollars, but in the billions. In spite of that, the company has an enormous market cap.
What’s notable about Splunk is the size of the top, which is five years wide. That’s an extraordinary amount of time for any security to be developing a topping pattern. It suggests that while the fall may be tremendous, it could also be slow in coming.
The stock peaked at about $225 and has a base to the top of about $95, suggesting a $130 price spread to the pattern.
The stock is presently valued at about the same price it was eight years ago, and it doesn’t have a long enough history to illustrate whether or not it has a propensity to fall significantly after a major top. The width, height and quality of the topping pattern is hard to deny, however.
Three of a kind
With all three of these trade ideas, the key word is “patience” because the kind of price move required to make a spectacular return on owning puts might take many months.
The chief ally in these trade ideas, however, is that price tops of this size will be subjected to a stupendous amount of gravity because overhead supply will persistently hamper attempts to push the price higher.
If the market is relatively weak in 2023, or even if it’s fairly flat, there’s a high probability all three of the stocks will be much lower in price by the end of the year. Given the dollar amount that these expensive stocks might move, the risk/reward ratio of owning long-dated puts seems tantalizing.
Tim Knight has used technical analysis to trade the equity and options markets for decades.
He founded Prophet Financial Systems and created the website slopecharts.com, which offers free
access to his charting platform. @slopeofhope