What Lies Ahead for Stocks
This column’s predictions for stock prices in 2022 have proven painfully correct. Now, the Technician is watching crypto for signals on how equities will perform in 2023.
The S&P 500 index reached its highest point in history on Jan. 4, 2022, the same day Luckbox published an article called Dark Days Ahead.
The story concluded with the warning that “for the year 2022 … stocks could be in serious trouble.”
The technical analysis was prescient as approximately $30 trillion of asset value soon evaporated. But where do we go from here?
Sinking from a lower high
The chart called A down period, below, shows the S&P 500 index divided by the money supply. As noted in the last year’s article, this “true value” of the index peaked early in 2000.
Even at the highest point of the COVID-19 infusion of cash, the value merely matched the top of the housing bubble in 2007. In other words, stock market prosperity has never approached the levels seen at the turn of the millennium.
Since January 2022, this chart has taken a sharp turn lower, principally because the index lost 20% of its value in a mere five months. Despite that fall, this ratio chart isn’t near principal support, suggesting it has farther to go before tagging its supporting trendline.
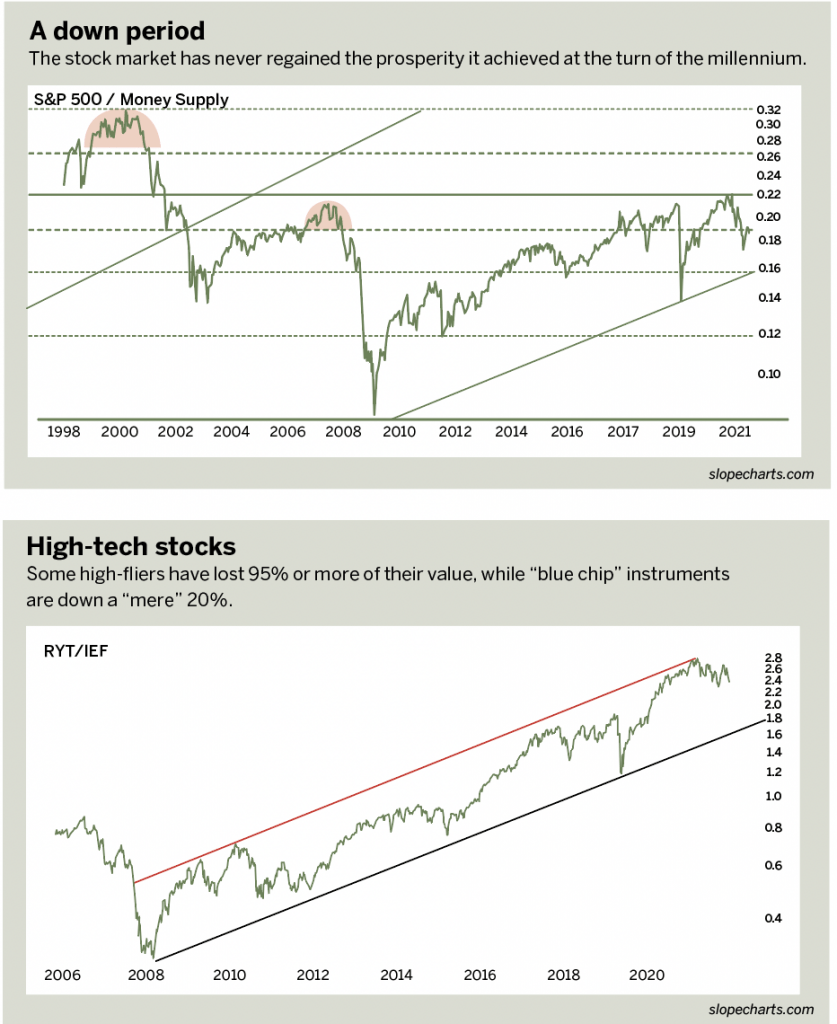
Tech loses hero status
High-tech stocks like Apple (AAPL), Amazon (AMZN), Meta Platforms (META) and Nvidia (NVDA) were once the darlings of the stock market. The RYT/IEF chart showed how, over a decade and a half, the relationship between technology and bonds followed a steady, ascending channel.
At the time of the January 2022 article, however, that ratio was tagging the higher trendline, suggesting that it had reached peak value and would slip lower.
That’s exactly what happened. Some high-fliers have lost 95% or more of their value, whereas relatively “blue chip” instruments like Apple are down a mere 20%.
The ratio chart has fallen well away from its upper trendline, but it isn’t even halfway through the presumed transit it should ultimately make. In other words, if the ratio chart gradually finds its way to the lower trendline, technology stocks should be markedly lower than they are now.
Interest rates
Another ratio chart in the same spirit as the RYT/IEF was the Nasdaq Composite (symbol $COMPQ) divided by the M2 money supply.
Here again, lofty valuations made possible by trillions of COVID-19 dollars caused the ratio to mash up against long-term resistance.
It has since turned down heartily, with SPAC (special-purpose acquisition company) stocks losing almost all of their value, and household name stocks, such as Amazon and Alphabet (GOOGL), losing one-fifth.
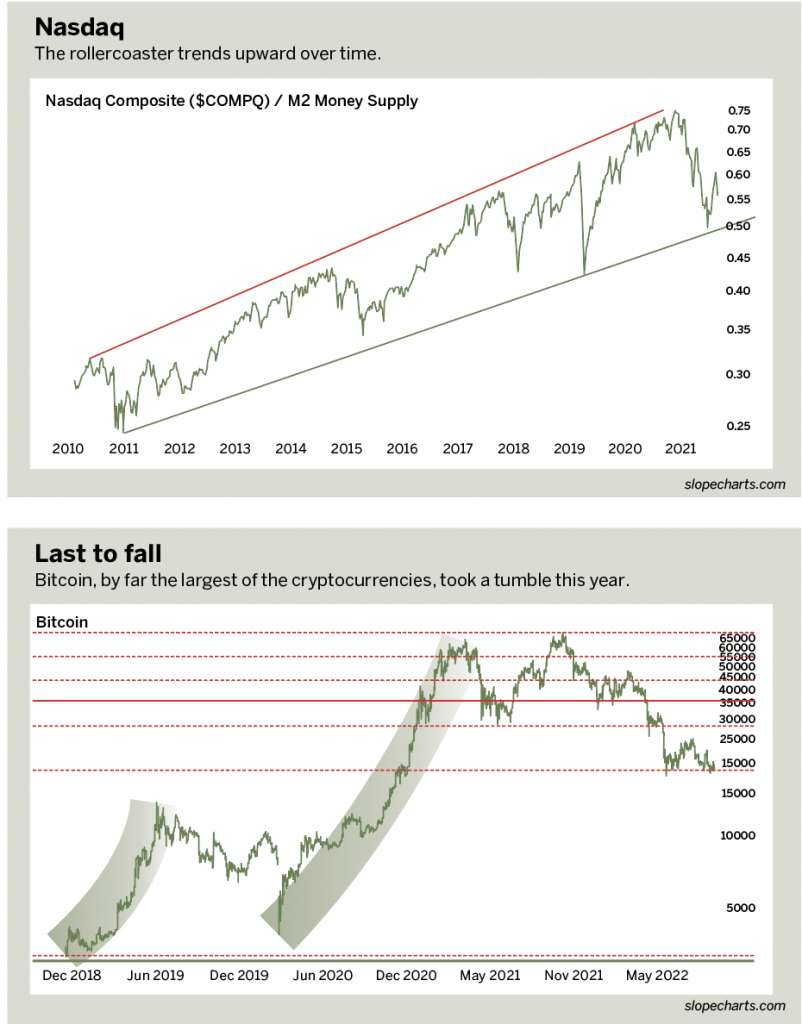
Last asset to fall
Since the bear market started on Jan. 4, assets across the board have been greatly diminished in value, from supposed inflation-fighting assets like gold, to equities, to bonds.
Few asset classes have been spared the carnage, and crypto has been no exception. Bitcoin, by far the largest cryptocurrency, tumbled from a peak of nearly $70,000 on Nov. 10, 2021, to below $17,600 on June 18, 2022, a 75% wipeout.
However, cryptos have not experienced their final collapse, which should accompany the capitulation event investors seem to anticipate. If the two principal “coins,” Bitcoin and Ethereum, break their major support levels, it will likely coincide with a final cathartic plunge in equities.
The collapse anticipated in the January article came to fruition with stupendous power, thanks to the decision by the central bankers of the world to stop manipulating the market. For a while, at least, they are letting the market be a market.
That will surely not be a permanent state of affairs, but a more or less organic market does tend to conform to classic patterns and technical analysis.
Tim Knight has used technical analysis to trade the equity and options markets for decades. He founded Prophet Financial Systems and created the website slopecharts.com, which offers free access to his charting platform. @slopeofhope