The VIX Cheat Sheet
Interested in knowing how much the S&P 500 is expected to move? This cheat sheet will help! But first, get the last sale of VIX or type “VIX” into your search engine. Then, look up the corresponding VIX level and the outlook for the desired theoretical expected range.

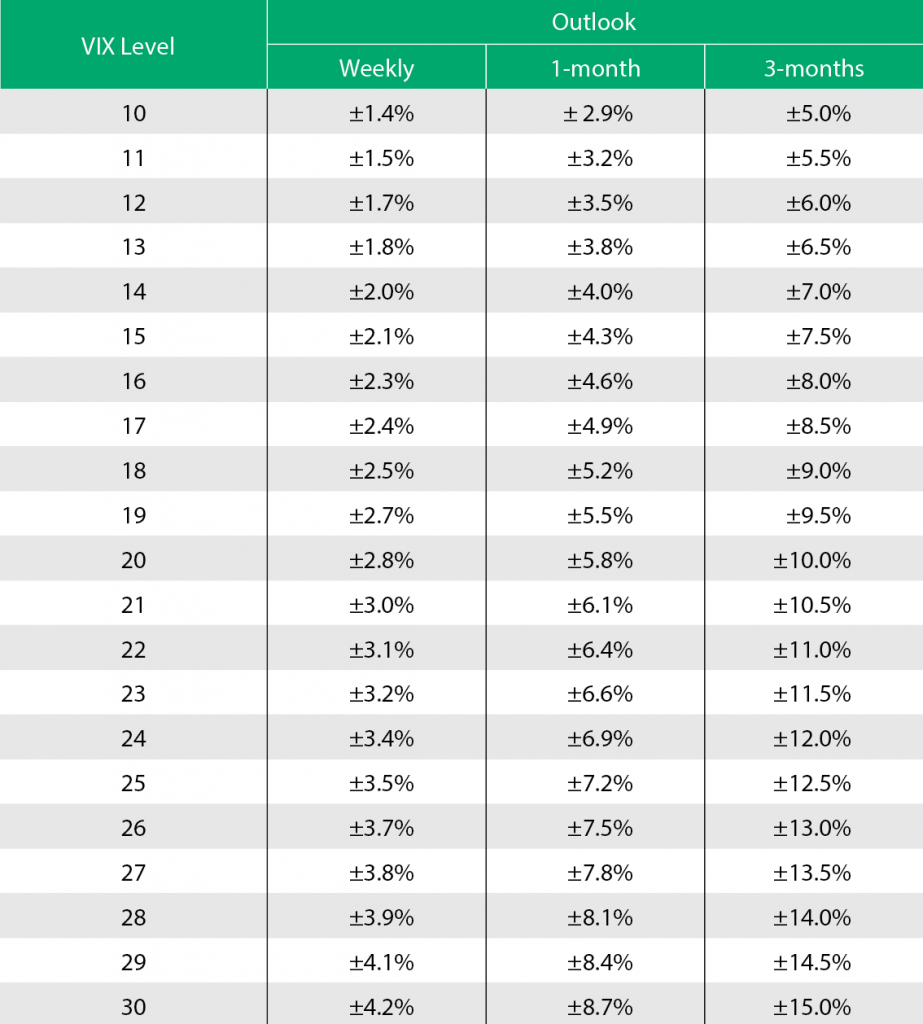
For example, in late August, the price of VIX was 20. The table to the right shows the one-week outlook at ±1.4%, one-month outlook at ±5.8%, and the three-month outlook at ±10.0%. This is where prices are expected to range, plus or minus.
The greater the outlook with respect to time and the greater the VIX levels, the greater the expected price ranges. Additionally, all expected ranges are plus or minus (±) and based on where prices are expected to range with a 68% probability at the end of one month or three months. The 68% probability, by the way, is based on a one-standard deviation. To find where prices are expected to be with a 95% probability, double the numbers from the charts.
For example, with a 95% probability and a VIX of 20, the S&P 500 is expected to fall within 5.8% x 2 = ± 11.6% within one month. For weekly VIX updates, sign up for the Cherry Picks newsletter at tastytrade.
Michael Rechenthin, Ph.D., (aka “Dr. Data”) is head of research and data science at tastytrade.