Volatility is Predictable
Twenty-first century financial media strive to gather enough clicks to churn millions of dollars in ad revenue. Those clicks are attained via exciting—or frightening—financial numbers that make for sensational headlines.
Only a microscopic subsection of the general population will click a headline that reads, “German Bund Yields Dropped Another 0.05% Today.” So instead, financial journalists reach for a big number headline, like one that reads, “Dow Jones Index Plummets 1,500 points” or “Apple Surpasses $2 Trillion in Market Value.”
While those articles grab eyeballs, they also make the market seem more intimidating to new investors. The market is already daunting enough for those hoping to take control of their financial future. They have new technology to learn and market jargon to decipher.
Should these new investors run away, hire a financial advisor and bury their heads in the sand? Absolutely not. The numbers can seem overwhelming, but it’s important to consider the big picture. On any given day it’s likely that multiple stocks will see 50%-100% increases, or, in some cases, 50% drops. But these are often small stocks in volatile market sectors, such as biopharmaceutical firms whose entire future may be pinned on the success of a single drug.
Looking at the macro level and contemplating the stock market as a whole, the percentage moves on any given day become more palatable. When 30, 100 or even 2,000 stocks are combined in one index, some large moves occur, but nothing close to the 50% single-day moves in some individual stocks.
Estimating price movement
While it may not be possible to know whether the stock market will move up or down next month, it is possible to estimate the magnitude of the movement in a specified time frame. It’s accomplished by using the implied volatility of the stock, index or exchange-traded fund. Traders can quickly find the implied volatility of any stock or fund on the tastyworks platform.
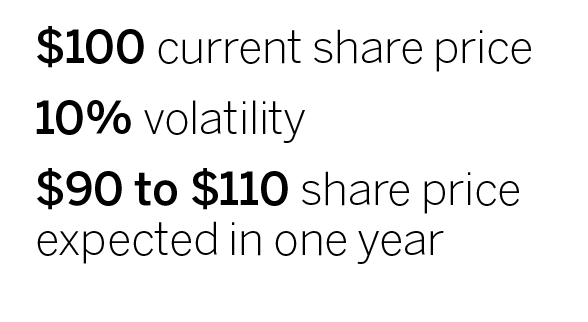
Implied volatility is a calculated value that expresses the annualized estimated percent movement of a financial product. For example, if a stock is trading for $100 per share and has implied volatility of 10%, it’s assumed that one year from today that stock will be trading somewhere between $90 and $110. This calculated range is known as one standard deviation, and it’s derived from statistical models. In theory, it’s expected that 68% of the time the stock will fall within a one standard deviation calculated range.
Given an implied volatility value, traders can quickly calculate a security’s estimated range for any chosen time frame. Take, for example, the S&P 500 Index (SPX) and its associated Volatility Index, the VIX. If the S&P Index is 3,400 and the Volatility Index is 22, what is the expected move for one day? How about 30 days? Here’s the calculation traders can use to gather these estimated ranges:
Expected Move = Price × (Implied Volatility)/100 × √(Days/365)
Plugging the above S&P and VIX values into this equation, the estimated one-day movement is 39 points, giving the S&P a daily range of 3,361 to 3,439. Using the same numbers for 30 days gives a range of 214 index points, from 3,186 to 3,614. Remember this is an approximation based on current prices and implied volatility. It’s expected that the S&P will fall within its calculated range approximately 68% of the time.
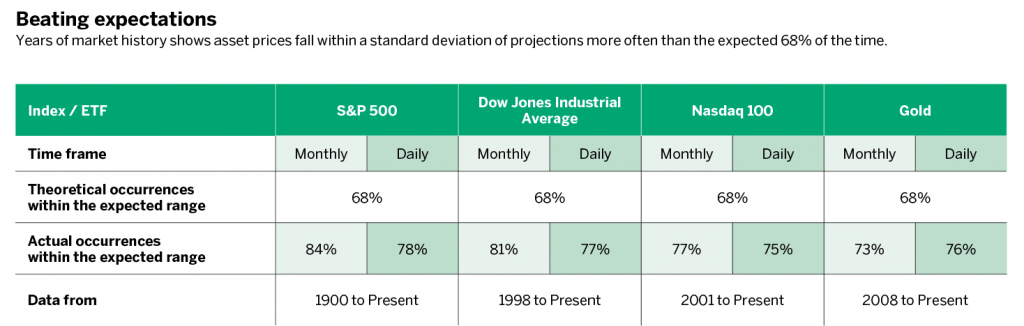
So, is this true? Has the market typically stayed within its range 68% of the time historically? Using published data for the S&P 500 Index and the VIX, traders can calculate historical expected ranges and compare them with the actual realized movement. With data dating back to 1990, they can calculate 30 years of expected and actual moves. Consider the table, which shows that for both daily and monthly expected moves the S&P 500 fell within the range far more often than expected: 78% and 84%, respectively. That demonstrates the principle that volatility, in the long run, is overstated.
Do the other stock indexes exhibit overstated volatility? Consider the same test on the Dow Jones Industrial Average Index and the Nasdaq 100 Index. The Dow Jones is often regarded as “blue-chip” stocks that are more stable, but it contains only 30 stocks. The Nasdaq 100 has more components than the Dow but is regarded as a more volatile index because of its tech-heavy concentration. The same test conducted on the Dow and Nasdaq yields similar results for both monthly moves and daily moves (see “Beating expectations,” below). Perhaps not surprisingly, the Nasdaq stays within its range slightly less than both the S&P and the Dow, yet it’s still about 7%-9% more often than theoretically expected.
Projections come true
All of the stock indexes historically stay within their implied volatility projected range more often than expected. The same holds true for other assets. Consider the table’s metrics regarding gold. Gold is often thought of as a volatile “safe-haven” commodity, where the price can surge in times of unease. While not as consistently in its range as the stock indexes, gold still beats the theoretical numbers.
Understanding the overstatement nature of volatility helps one become a sensible investor or trader who can sleep soundly at night. Long-term bullish investors should internalize this and know large down days and down months will occur, and that they will have to ignore the noise of those shorter-term moves. Traders can embrace volatility more proactively. Scalpers can use expected ranges to calculate possible targets for taking gains and losses intraday. Premium sellers who short options contracts can place their trades outside the expected move with some confidence they will make money if the stock stays within its range.
Large market numbers are off-putting, and understanding volatility can be daunting but traders who take the initiative to understand volatility and know how to use it to their advantage will have an advantage over the competition. As with all aspects of trading, understanding volatility takes patience, dedication and due diligence.
James Blakeway serves as CEO of Quiet Foundation, a data science-driven subsidiary of tastytrade that provides fee-free investment analysis services for self-directed investors.@jamesblakeway