The Small Cap Surge: A New Chapter in the 2024 Bull Run
Market breadth has been weak during the recent bull run, but it may be strengthening

- The early stages of the current bull run were marked by historically narrow breadth, with a small group of stocks driving the gains.
- But the breadth of the rally appears to be improving, as evidenced by the fact that 73% of the stocks in the S&P 500 and Nasdaq Composite are now trading above their 200-day moving averages.
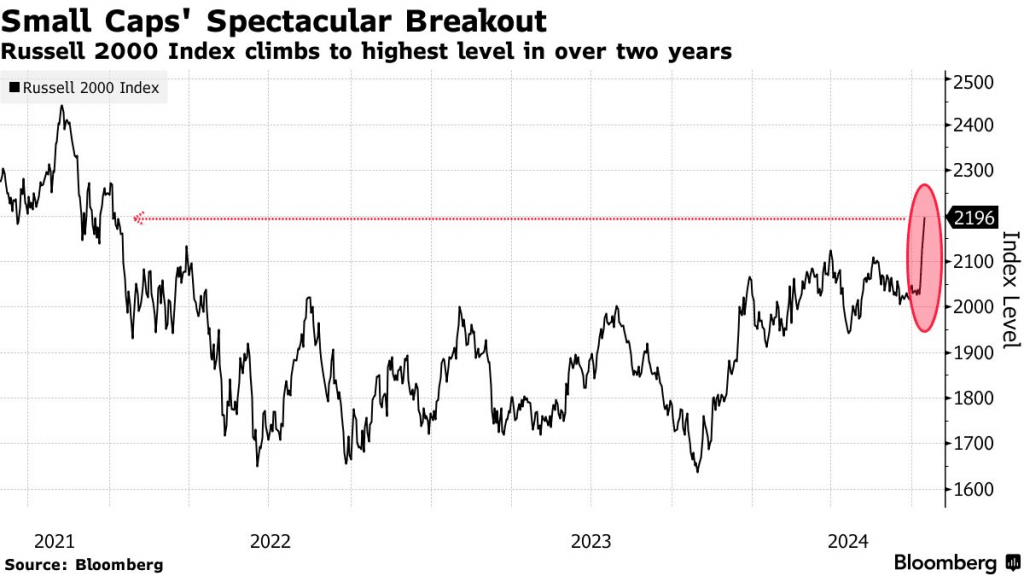
- Moreover, the Russell 2000—an index focused on small-cap stocks—recently experienced a significant breakout, climbing by about 9% in just 30 days.
Looking at the returns in the S&P 500 since the start of 2023, it’s difficult to argue the recent bull run hasn’t been “healthy.” The index has surged approximately 46%.
However, analysts often assess the “health” of a rally by examining market breadth—a key factor in determining sustainability. By this metric, the bull run that started roughly 18 months ago hasn’t quite fit the bill, at least not until recently.
Market breadth appears to be widening
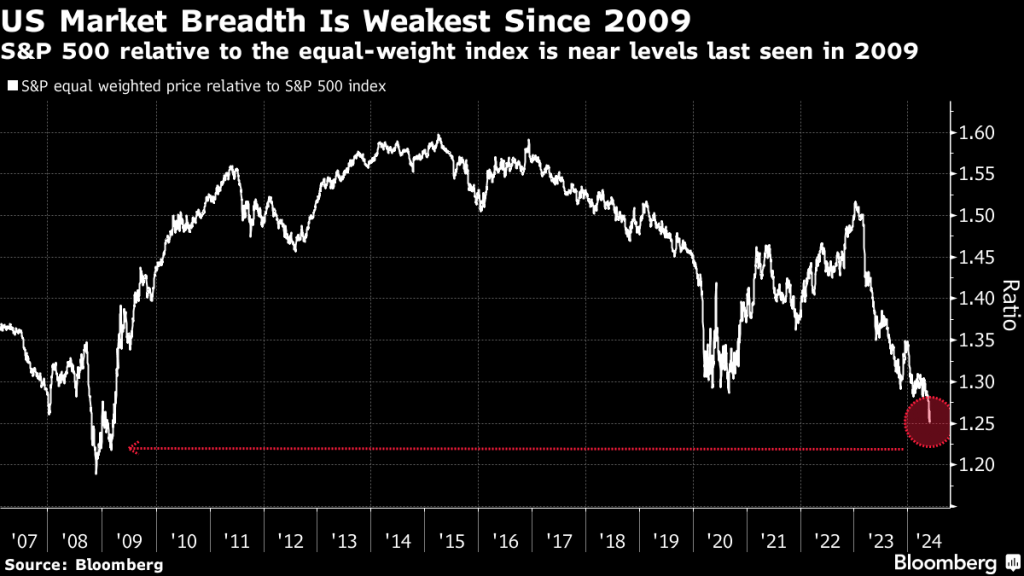
The largest returns during the latest bull run have been concentrated in certain niches—particularly large cap technology companies like Meta (META), Microsoft (MSFT) and Nvidia (NVDA). One could argue that the returns have been too concentrated.
During the first nine months of 2023, 90% of the positive returns in the S&P 500 were attributable to just 10 stocks. The concentration was so intense that one has to go back to 1990 to find a comparable situation.
That historically high concentration of top performers also meant those 10 companies represented 32% of the total market capitalization in the S&P 500. And according to Amundi Asset Management, that historical extreme presented an opportunity to invest in other large cap stocks, which might benefit as the breadth of the rally widened.
Based on recent activity in the stock market, Amundi may have been right. As of July 2024, it appears the breadth of the current bull run is widening. Three hundred stocks on the New York Stock Exchange recently notched fresh highs for the year. Along those same lines, 106 stocks in the S&P 500 hit new 52-week highs in mid-July, which was the most since spring of 2021.
These figures provide clear evidence that the 2023-2024 bull run has taken on a healthier complexion, as least from a market breadth standpoint.
The importance of moving averages
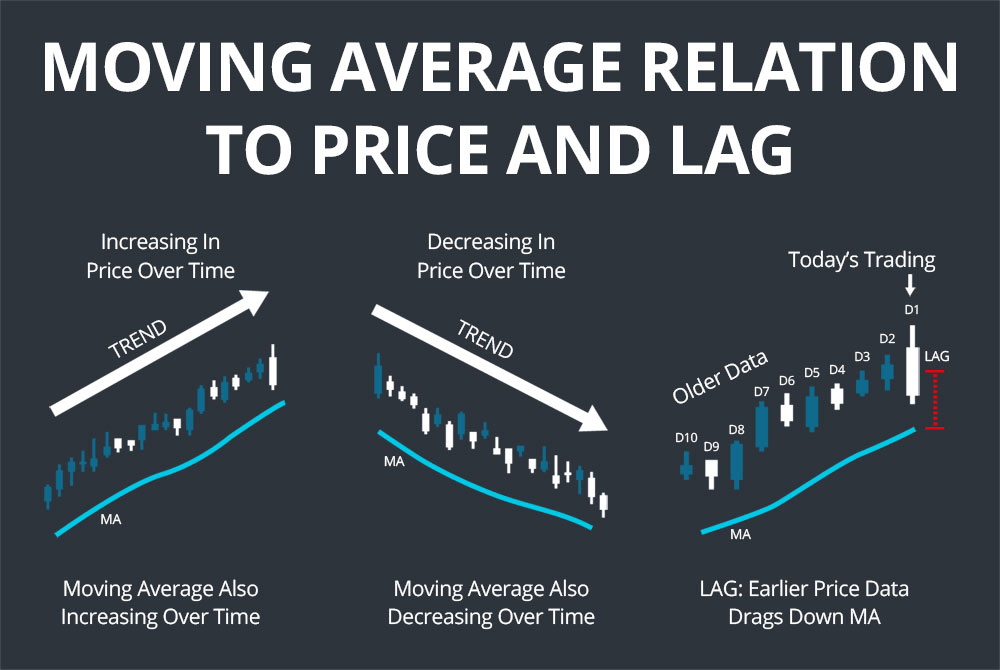
When assessing market breadth, one of the most important indicators to consider is moving averages.
At its core, market breadth refers to the number of stocks that are rising compared to the number falling. When the former significantly outnumbers the latter, it suggests a broad-based rally, which is generally more sustainable and less susceptible to correction. That’s because robust breadth translates to broad participation, which theoretically makes a rally more sustainable.
And when it comes to measuring market breadth, one of the most important indicators is moving averages.
Moving averages—an essential tool in technical analysis—help analyze longer-term trends in individual stocks, stock indices or any other tradable asset that can be charted. A simple moving average (SMA) calculates an asset’s average closing price over a specific time frame and is typically displayed as a line on a price chart to help identify emerging trends.
For example, the 200-day moving average (DMA) in the S&P 500 is one of the most-followed SMAs. It is calculated by summing the closing prices of the last 200 sessions and then dividing that total by 200. This calculation is updated daily, creating a smooth line that reveals trends over time.
From a market breadth perspective, the 200-DMA is particularly valuable because it covers a longer period than the 50-DMA or 100-DMA. This extended period helps smooth out daily volatility and provides a clearer picture of the overall market trend.
Importantly, when a security trades above its 200-DMA, it is generally viewed as constructive, signaling a continuation of an uptrend. Conversely, a drop below the 200-DMA is often seen as a breach of the trend, potentially indicating a bearish signal.
At present, roughly 73% of the stocks in the S&P 500 are trading above their 200-dma. In comparison, that figure was as low as 25% last fall, when the market suffered a temporary correction. Similarly, about 73% of the Nasdaq Composite components are now trading above their 200-DMA.
Like the aforementioned data on new market highs, these moving average trends underscore how the breadth of the 2023-2024 rally has improved this year.
Small cap stocks join the party
Looking beyond the large-cap universe, another encouraging sign for the 2023-2024 rally has been the recent breakout in small-cap stocks. Last December, Luckbox indicated 2024 could be a good year for the small cap niche of the stock market.
Small-cap stocks are typically defined as those with market capitalizations between $250 million and $2 billion. Alternatively, some consider the small-cap universe to include the bottom 10% of all publicly traded stocks by market capitalization.
One of the most-followed gauges of small-cap performance in the United States is the Russell 2000. This index comprises the 2,000 smallest companies in the broader Russell 3000 Index.
The Russell 2000 has lagged behind its larger-cap counterparts during the 2023-2024 rally.
While the S&P 500 is up roughly 46% since the start of 2023, the Russell 2000 has only gained about 17% over the same period. This lagging performance has been cited as a weakness in the current rally, particularly regarding market breadth. However, after a sharp surge, the Russell 2000 is now up 9% in just 30 days.
The recent rally in the Russell 2000 has significantly affected the 200-day moving average (DMA) of the index. As recently as June, less than 45% of the stocks in the Russell 2000 were trading above their 200-DMA. But as of mid-July, that figure has surged to 65%
This data illustrates how the relative health of the current bull market has steadily improved throughout 2024.
Does healthy market breadth guarantee the rally will continue?
While strong breadth suggests that many stocks are contributing to the rally, making it more robust and less reliant on a few high-performing stocks, it certainly does not eliminate other risks that could negatively influence the market. Economic conditions, geopolitical events, changes in interest rates and other macroeconomic factors can all influence the market’s direction, regardless of market breadth.
Therefore, while healthy market breadth is a good indicator of a potentially sustainable rally, it shouldn’t necessarily supersede other considerations. For example, recent deterioration in the U.S. labor market has pushed the “Sahm indicator” toward a critical level, which suggests the risk of recession remains elevated.
Recessions have historically been like kryptonite for the stock market. So, if the Sahm rule does get triggered over the next couple of months, it could represent a bearish signal for the underlying economy and potentially the stock market—regardless of market breadth.
On the other hand, if the Federal Reserve intervenes to cut interest rates and the underlying economy strengthens, the widening breadth of the rally could propel it to even greater heights. Regardless of which scenario plays out, active investors should expect increased volatility come autumn because September and October tend to be the most volatile months on the calendar.
Andrew Prochnow has more than 15 years of experience trading the global financial markets, including 10 years as a professional options trader. Andrew is a frequent contributor of Luckbox Magazine.
For live daily programming, market news and commentary, visit tastylive or the YouTube channels tastylive (for options traders), and tastyliveTrending for stocks, futures, forex & macro.
Trade with a better broker, open a tastytrade account today. tastylive, Inc. and tastytrade, Inc. are separate but affiliated companies.