What You Need to Know About the Scorching Rally in India
The Indian stock market has staged a furious rally in 2021, and moreover, it hasn’t faltered amidst the recent correction in Chinese shares.

In sharp contrast to the recent selloff in Chinese equities, the Indian stock market has climbed to fresh all-time highs this year, and counts among the world’s best performers through the first eight months of 2021.
So far this year the “NIFTY 50″—India’s most visible stock index—is up approximately 31%. That’s good for fourth place on the list of global top performers in 2021, following Saudi Arabia (+40%), Russia (+36%) and Austria (+33%).
Of course, the major U.S. stock indices have also put up impressive numbers this year, with the Nasdaq 100, Dow Jones Industrial Average and S&P 500 rising 23%, 16% and 22%, respectively.
The NIFTY 50 is a benchmark Indian stock market index that represents the weighted average of 50 large Indian companies listed on the National Stock Exchange (NSE). The NIFTY 50 and the BSE Sensex are two of the most heavily traded indices in India.
The BSE Sensex is made up of 30 companies from the Bombay Stock Exchange (BSE) and has risen approximately 21% in 2021.
Much like other areas of the globe, the IT sector has been at the forefront of the recent rally in Indian shares. Beyond that, other high-flyers in the Indian market hail from the following sectors: real estate, utilities, healthcare and basic materials.
Unlike Chinese listings, Indian shares aren’t commonly listed in the U.S. via American depository receipts (ADRs)—meaning that many of the more prominent Indian companies are less visible to U.S.-based investors and traders. That said, some of the best-performing Indian stocks in 2021 include:
- Majesco (+436%)
- Happiest Minds Technologies (+324%)
- Brightcom Group (+318%)
- Hikal (+275%)
- Tata Elxsi (+129%)
- eClerx Services (+140%)
- Adani Transmission (+120%)
- Tata Steel (+120%)
- Mahindra Lifespace Developers (+105%)
- APL Apollo Tubes (+104%)
- Max Healthcare (+102%)
- Laurus Labs (+99%)
- Poly Medicure (+85%)
- Indiabulls Real Estate (+76%)
While steep appreciation in Indian shares has investors cheering, there are signs that a bubble may be forming. Much like in the U.S., metrics such as the “Buffett Indicator” have started to indicate that valuations in the Indian market are stretching toward extremes.
The Buffett Indicator measures the total value of a given sovereign stock market versus a given country’s gross domestic product (GDP). At this time, India’s market capitalization-to-GDP ratio is trading at fresh all-time highs—roughly 172%.
That level is more than double the 15-year median market cap-to-GDP ratio of 75%, and about 15% higher than the previous all-time peak observed in 2007.
Of course the Buffett Indicator isn’t the only consideration at this time, and given the broader global rally in stocks, a correction in Indian shares may not occur until other global stock markets start to falter.
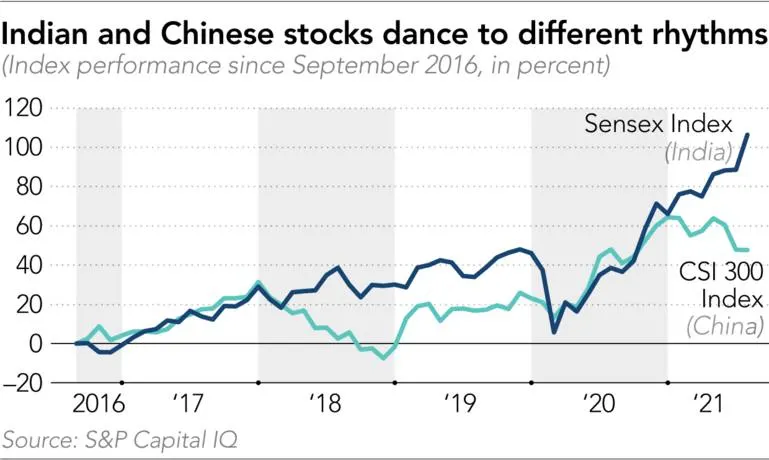
Interestingly, the Chinese and Indian stock markets do not share much of a correlation—positive or negative. Trading data over the last 18 months shows that India’s Sensex index correlation with China’s CSI 300 has been only 0.04 (basically zero).
When correlations are near or at zero, that indicates that the two underlyings in question move independently of each other (i.e. there’s no discernible link between the two when it comes to movement). Given that India and China are two of the more prominent “BRIC” countries, that may come as a bit of a surprise.
Generally speaking, investors and traders tend to prefer trading securities that aren’t highly correlated, because taking the same position in highly correlated securities effectively represents doubling down on the same bet. High correlations, on the other hand, tend to be preferred in pairs structures.
In this case, the lack of correlation in Chinese and Indian shares might actually be viewed as an opportunity—depending on one’s unique strategic approach, outlook and the specific opportunity at hand.
To access the Indian markets, investors and traders can do so using the shares and options of exchange-traded funds (ETFs) such as iShares MSCI India ETF (INDA), WisdomTree India Earnings Fund (EPI), iShares India 50 ETF (INDY) and iShares MSCI India Small Cap ETF (SMIN).
For China-focused opportunities, market participants can also investigate some of the most prominent Chinese country ETFs, such as KraneShares CSI China Internet ETF (KWEB), iShares MSCI China ETF (MCHI), iShares China Large-Cap ETF (FXI), Xtrackers Harvest CSI 300 China A-Shares ETF (ASHR) and SPDR S&P China ETF (GXC).
To learn more about trading country ETFs, readers can review this previous installment of Market Measures on the tastytrade financial network. And for updates on everything moving the markets, TASTYTRADE LIVE—weekdays from 7 a.m. to 4 p.m. CST—is also recommended.
Sage Anderson is a pseudonym. He’s an experienced trader of equity derivatives and has managed volatility-based portfolios as a former prop trading firm employee. He’s not an employee of Luckbox, tastytrade or any affiliated companies. Readers can direct questions about this blog or other trading-related subjects, to support@luckboxmagazine.com.