CSI: Investigating Thrift Savings Plans
It’s 1987. Ronald Reagan is serving his second term as president, Paul Simon’s Graceland wins the Grammy for album of the year and the U.S. stock market witnesses Black Monday, the worst day in U.S. market history. While most of the financial industry remembers 1987 because of Black Monday, the year also saw the creation of the Thrift Savings Plan (TSP), the government’s version of a 401(k).
At the end of 2018, 5.5 million current and former public sector employees had TSP accounts totaling $559 billion in assets. The 401(k) plans, which vary dramatically depending upon the employer as well as the plan provider, tend to offer a plethora of mutual funds to account holders. TSPs, on the other hand, are straightforward when it comes to fund choices. While this could come across as limited choice, the funds provide broad and varied access to the debt and equity markets.
TSP participants have three core choices for stock-based funds: the C, S, and I funds. All three are invested to track stock indexes. The C Fund seeks to track the S&P 500 Index, 500 of the largest U.S. public companies. The S Fund’s objective is to track the Dow Jones U.S. Completion Total Stock Market Index, a broader stock market index of 4,500 companies. Lastly, the I Fund is invested to provide TSP participants exposure to the MSCI EAFA (Europe, Australasia, Far East) Index. The I Fund’s goal is to provide a global, non-U.S. equity choice.
For fixed-income assets, TSP participants have access to the G Fund and the F Fund. The G Fund holds a basket of U.S. treasury securities issued directly to the fund. The fund goal is to earn a return consistently higher than inflation with the promise of no principal risk. Managers of the F Fund, a more aggressive debt investment, purchase assets in an attempt to track the Bloomberg Barclays U.S. Aggregate Bond Index. That gives TSP investors more aggressive exposure with a diversified portfolio of investment-grade notes and bonds.
Besides the individual funds, the TSP administration offers a selection of Lifecycle Funds. The L Funds operate much like target date retirement mutual funds. The available funds are for those retiring around 2020, 2030, 2040 and 2050. These L Funds are comprised solely of the five TSP debt and equity funds. They shift allocations from the C, S, and I Funds to the F and G Funds as the intended TSP participants approach retirement. As an example, the L 2050 Fund is currently allocated as 10.5% G Fund, 7.7% F Fund, 40% C Fund, 13.1% S Fund and 28.6% I Fund. Ultimately, only 18.2% is allocated in debt instruments. However, with 90-day treasury interest rates at 1.66%, and 30-year treasury rates at 2.24%, these funds may remain stagnant in the near term. Younger TSP participants may want to take matters into their own hands and shift more capital into the equity funds, given the longer time horizon of their investments.
TSP investors are given broad access to financial markets through these low-cost funds, but what about participants who invest outside of their TSP plan? Similar to 401(k) plans, TSP plans likely make up a large portion of these individuals’ retirement assets. As always, it’s important for investors to know their exposure across all accounts and retirement plans. TSP participants should keep their TSP fund allocations at the forefront of their minds when making external investment decisions, whether they’re investing in an IRA, Roth IRA or brokerage account.
One way of understanding risk and exposure is to compare the TSP funds to exchange-traded funds (ETFs). Unfortunately, the G Fund does not have an ETF equivalent because it receives custom-issued treasuries. That’s less of a concern given the guarantee that G Fund investors will not lose their principal investment. The other four funds can be matched to exchange-traded counterparts. While the S Fund tracks the Dow Jones U.S. Completion Total Stock Market Index, no ETFs track that exact index. However, the iShares Russell 3000 index ETF (IWV) tracks a similar broad basket of stocks.
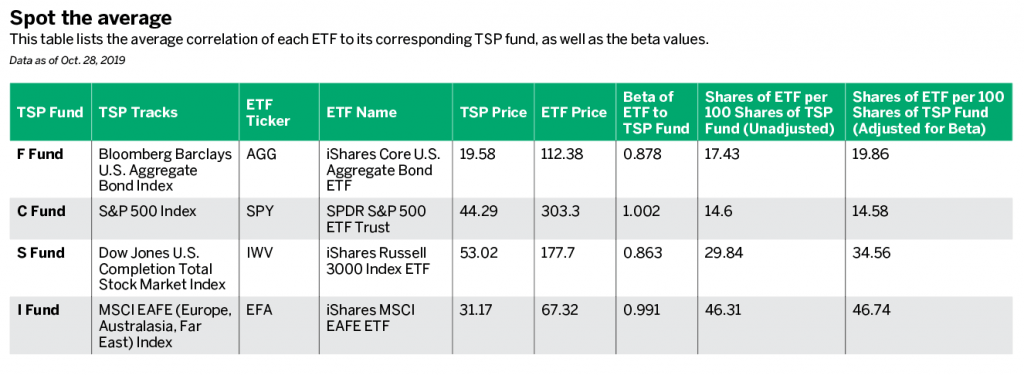
The table in “Spot the average,” below, lists the average correlations of each ETF to its corresponding TSP fund as well as the beta values. With all four correlation values around or above 0.9, there’s a high confidence that these ETFs are tracking the day-to-day direction of the TSP funds. The beta values take it a step further, looking at the magnitude of the movement of each ETF relative to the movement of the TSP fund. A beta of 1.0 indicates equivalent movement of the ETF to the respective TSP fund, and above 1.0 means higher-magnitude moves, while less than 1.0 indicates lower-magnitude moves.
So why go to the trouble of calculating correlations and betas? Because it enables TSP investors to compare their TSP funds to products familiar to the rest of the financial industry. Dividing the TSP fund price by the ETF price gives the equivalent number of ETF shares per share of TSP fund. Dividing that value by the beta adjusts for the discrepancies in how much the products move day to day. Armed with that information, TSP participants can analyze their fund holdings through Quiet Foundation’s free Exploratory Portfolio Analysis system. TSP funds are not listed securities and are therefore not generally supported by most financial analysis software, but the ETF equivalents can be analyzed.
Quiet Foundation’s analysis system indicates that the IWV and EFA ETFs currently exhibit correlations to the S&P 500 Index of 0.99 and 0.89, respectively. That means there are extremely high correlations between the C, S, and I Funds. Knowing that, TSP participants can choose more diverse, less-correlated investments outside of their TSP accounts. All three of the TSP equity funds are concentrated in United States stocks and developed economy stocks, but do not include developing or emerging market stocks. Younger investors may look to add some more diverse global exposure, potentially using ETFs such as EEM, the iShares emerging market ETF.
Just like 401(k) contributors,
TSP participants should be cognizant of the inner workings of their portfolios and where their exposure liesFrom there, they can make more informed decisions regarding any external investment. As always, for all investors, it comes down to due diligence.
Click here to learn how to evaluate any portfolio with Quiet Foundation.
James Blakeway serves as CEO of Quiet Foundation, a data science-driven subsidiary of tastytrade that provides fee-free investment analysis services for self-directed investors.