2021 Markets: Memes, Cryptos, and the Biggest Winners and Losers
The 2021 trading year is almost in the books, and a review of this year’s biggest winners and losers should help investors and traders strategize for 2022.

The 2021 trading year is almost in the books, and with many investors and traders strategizing for 2022, it’s helpful to review some of the more notable winners and losers from the past year.
As many will recall, the energy sector was one of the biggest losers from the 2020 trading year, so it’s been especially interesting to see that sector leapfrog to the head of the class in 2021. Crude oil and natural gas prices are up 57% and 60%, respectively, in 2021.
Of course, the emergence of the new “meme” niche of the stock market—featuring names like Gamestop (GME) and AMC Entertainment (AMC)—has also been a huge story in 2021.
But before diving into some of the best- and worst-performing stocks and ETFs, let’s first review some of the top international markets year-to-date. Not surprisingly, the tech sector in the U.S. once again produced some of the largest gains among the world’s best-known indices, as highlighted below:
- Nasdaq 100 (USA), +30.5%
- S&P 500 (USA), +29.5%
- BSX (Bermuda), +27.5%
- CAC 40 (France), +27.4%
- AEX (Netherlands), +26.3%
- OMX 30 (Sweden), +25.8%
- TSX (Canada), +21.0%
- TecDAX (Germany), +20.3%
- Dow Jones (USA), +20.0%
- SENSEX (India), +19.9%
- IPC (Mexico), +19.0%
Of those countries absent from the above list, China is likely the most conspicuous. And while China didn’t qualify as one of the worst underperformers, the relatively flat returns observed in that region during 2021 are notable, with the Shanghai Composite rising only 3% in 2021.
Indices in Japan and Korea produced equally anemic returns in 2021, with the Korean KOSPI rising only 2% in 2021, and the Japanese NIKKEI 225 rising 5%.
Other notable global underperformers this year included: the Hang Seng in Hong Kong (-15%), the IGPA in Ecuador (-15%), and the BOVESPA in Brazil (-11%).
To learn more about trading country ETFs, readers may want to review this previous installment of Market Measures on the tastytrade financial network.
Best- and Worst-Performing ETFs in 2021
Moving on from the global indices, it’s also helpful to review some of the best- and worst-performing ETFs from 2021.
In terms of top performers, the list is dominated by global commodities, especially those focusing on energy production (oil, natural gas and uranium):
- Breakwave Dry Bulk Shipping ETF (BDRY), +158%
- KraneShares Global Carbon Strategy ETF (KRBN), +97%
- First Trust Natural Gas ETF (FCG), +77%
- North Shore Global Uranium Mining ETF (URNM), +77%
- Invesco Dynamic Energy Exploration & Production ETF (PXE), +75%
- VanEck Rare Earth/Strategic Metals ETF (REMX), +65%
- SPDR S&P Oil & Gas Exploration & Production ETF (XOP), +61%
- United States Oil Fund LP (USO), +58%
- Global X Uranium ETF (URA), +53%
- Vanguard Energy ETF (VDE), +48%
- Fidelity MSCI Energy Index ETF (FENY), +46%
The list of worst-performing ETFs also reflects a common theme, but in this case, it appears to be exposure to China. And despite early optimism over renewable energy heading into 2021, some of those ETFs haven’t performed that well either, as illustrated below:
- iPath Series B S&P 500 VIX Short-Term Futures ETN (VXX), -70%
- KraneShares CSI China Internet ETF (KWEB), -53%
- Global X Education ETF (EDUT), -50%
- Invesco Golden Dragon China ETF (PGJ), -48%
- Global X Emerging Markets Internet & E-commerce ETF (EWEB), -41%
- Invesco WilderHill Clean Energy ETF (PBW), -40%
- iShares Trust – iShares Global Clean Energy ETF (ICLN), -36%
- Global X MSCI China Comm Services ETF (CHIC), -32%
- VanEck Vectors Junior Gold Miners ETF (GDXJ), -22%
To learn more about trading sector ETFs, readers can review this previous installment of Options Jive.
Best- and Worst-Performing Stocks in 2021
With the S&P 500 climbing by roughly 30% in 2021, there were plenty of outperformers in the stock market this year. But of course, every trading year features some outsized losers as well. Listed below are the best- and worst-performing stocks from 2021 (market capitalizations greater than $10 billion).
Best-Performing Stocks
- Hertz (HTZ), +1,852%
- AMC Entertainment (AMC), +1,253%
- Gamestop (GME), +687%
- Avis Budget Group (CAR), +498%
- Upstart Holdings (UPST), +292%
- Lucid Group (LCID), +286%
- BioNTech (BNTX), +212%
- Synaptics Inc. (SYNA), +203%
- Continental Resources (CLR), +185%
- Devon Energy Corp (DVN), +182%
- Alcoa Corp (AA), +159%
- Asana (ASAN), +158%
- Marathon Oil (MRO), +148%
Worst-Performing Stocks
- Peloton Interactive (PTON), -75%
- Quantumscape (QS), -72%
- KE Holdings (BEKE), -68%
- Pinduoduo (PDD), -68%
- Tencent Music (TME), -68%
- Lufax Holding (LU), -60%
- Teladoc Health (TDOC), -53%
- UWM Holdings (UWMC), -52%
- Coupa Software (COUP), -52%
- Zillow Group (Z), -51%
- Alibaba (BABA), -50%
- Ring Central (RNG), -49%
- Bilibili (BILI), -48%
To hear more about the outlook for meme stocks in 2022, readers are encouraged to review a new episode of Hear Me Out on the tastytrade financial network. This episode features tastytrade co-founder and co-CEO Tom Sosnoff, who shares his perspective on this unique niche of the financial markets.
Crypto Round-Up
A review of 2021 wouldn’t be complete without a rundown of the best- and worst-performing cryptocurrencies.
Best-Performing Cryptocurrencies
- Polygon (MATIC), +11,026%
- Terra (LUNA), +9,530%
- Solana (SOL), +9,160%
- Dogecoin (DOGE), +2,819%
- Avalanche (AVAX), +2,754%
- Shiba Inu (SHIB), +1,450%
- Binance Coin (BNB), +1,294%
- Crypto.com Chain (CRO), +780%
- Cardano (ADA), +588%
- Ethereum (ETH), +416%
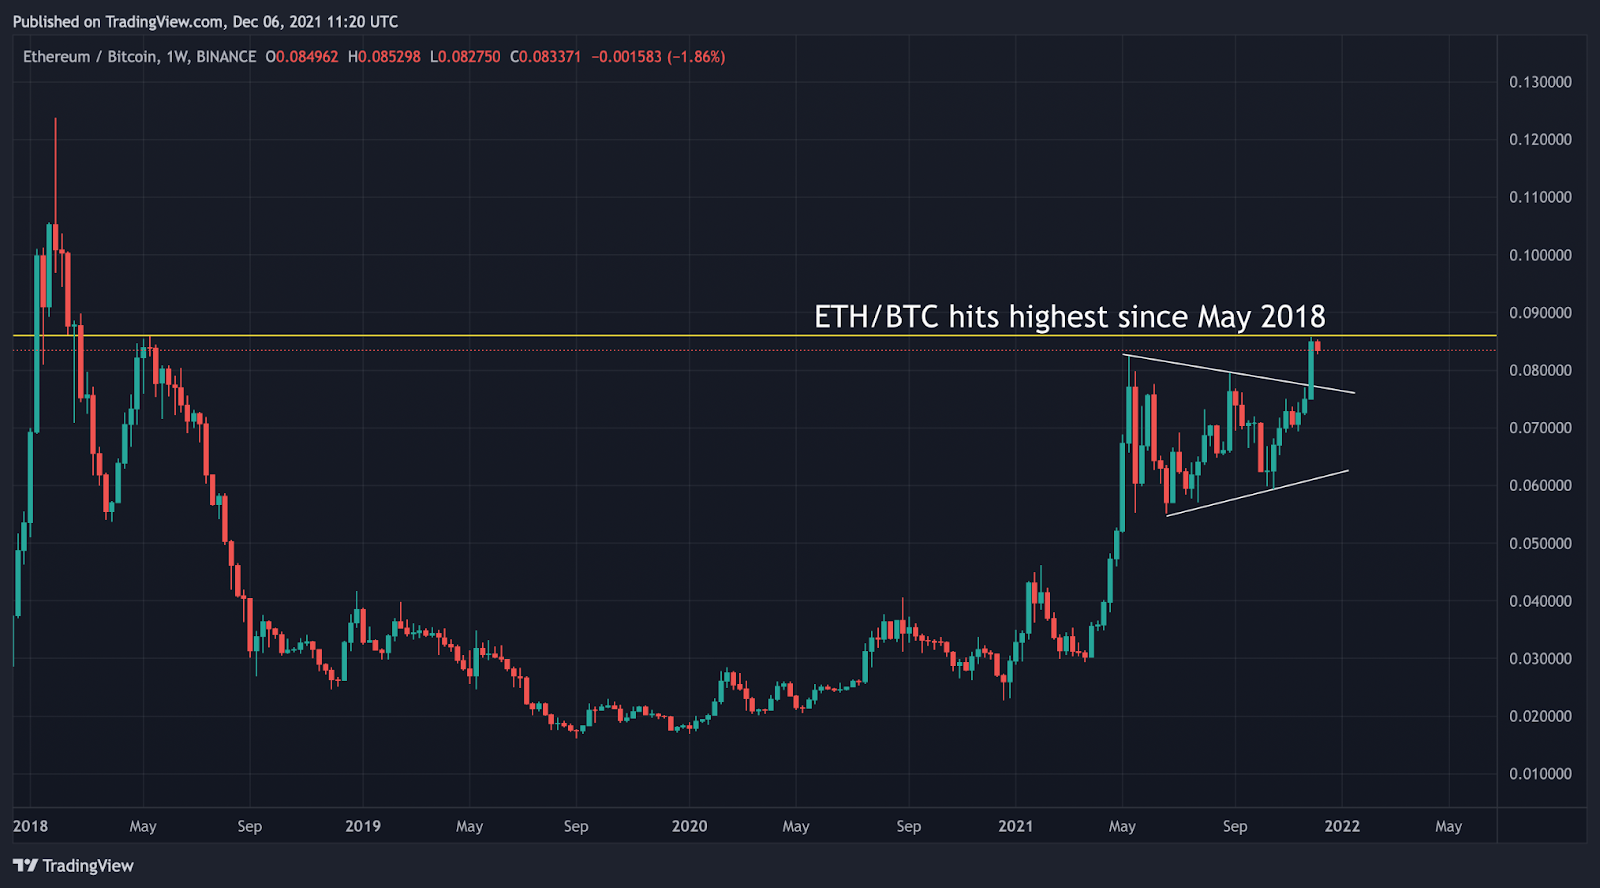
Aside from its impressive 400%+ gains, Ethereum has also been notable in 2021 as a result of its appreciation relative to Bitcoin. Bitcoin and Ethereum are the undisputed titans of the crypto universe, so any shift in their trading relationship is arguably very important.
Much like the gold/silver ratio in the precious metals space, traders in the crypto market monitor the relationship between these two crypto titans using a ratio known as the Ethereum/Bitcoin ratio, or ETH/BTC. In basic terms, this ratio reports how much Bitcoin is required to purchase a single ethereum.
Considering that equation, it’s easy to see why bitcoin enthusiasts might cheer for the lowest possible ETH/BTC ratio, while Ethereum enthusiasts might cheer for the opposite.
At current prices, the Ethereum/Bitcoin ratio is roughly 0.08. That means 0.08 of a Bitcoin is needed to purchase a single ethereum.
Of late, Ethereum enthusiasts have had a lot to cheer for, as the ETH/BTC ratio hit a 3.5-year high in December. Through the course of 2021, the ratio has ranged between roughly 0.02 and 0.09, and is currently trading at the upper end of that range.
In terms of losers, some of the larger pullbacks in the cryptocurrency sector were observed in the following coins: Internet Computer (ICP, -96% from 2021 peak), EOS (EOS, -86% from April 2018 all-time high), Monero (XMR, -66% from Jan. 2018 all-time high).
To learn how the cryptocurrency sector’s correlation with the “traditional” financial markets shifted in 2021, readers are encouraged to review this new installment of Market Measures on the tastytrade financial network. For more on the 2022 outlook in the tech sector, this link is also recommended.
For timely updates on everything moving the financial markets in 2022, readers can also tune into TASTYTRADE LIVE—weekdays from 7 a.m. to 4 p.m. CST—at their convenience.
Sage Anderson is a pseudonym. He’s an experienced trader of equity derivatives and has managed volatility-based portfolios as a former prop trading firm employee. He’s not an employee of Luckbox, tastytrade or any affiliated companies. Readers can direct questions about this blog or other trading-related subjects, to support@luckboxmagazine.com.