Trading Post-Pandemic Shifts in Market Correlations
The extreme shifts in market correlations observed during the heights of the COVID-19 pandemic have now mostly “normalized,” and in some cases, even dropped below pre-pandemic levels.

When market volatility moves to an extreme—whether complacent or chaotic—market correlations tend to shift.
Such changes can provide investors and traders with important insights into the current risk environment, and are also fairly easy to monitor.
As a reminder, correlation—as it relates to the financial markets—refers to the degree to which securities or assets move in relation to each other.
For example, when two underlying securities are positively correlated, that means they move in the same direction—to varying degrees. On the other hand, when two securities are negatively correlated, that means they move in opposite directions—to varying degrees. If no correlation exists between two securities then the relationship is often categorized as “zero correlation.”
Historically, correlations tend to shift based on the level of volatility in the market. Case in point, when global equity markets started to correct at the outset of the COVID-19 pandemic, correlations in the market increased—meaning different assets started moving in the same direction to a greater degree.
Correlations tend to increase during market corrections because investors and traders become less focused on nuances in the market, and instead seek to “sell, sell, sell” without prejudice. In complacent markets, correlations tend to decline as investors and traders chase a wide-variety of different ideas and strategies across the financial spectrum.
New research conducted by tastytrade helps illustrate how correlations shifted before the pandemic, during the pandemic and after the pandemic—data which should help market participants position their portfolios going forward, or at least assist with ongoing portfolio risk management.
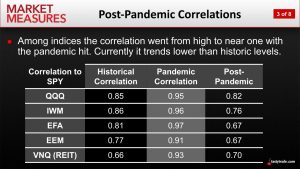
As highlighted in the graphic below, correlations in the stock market increased significantly during the darkest days of the COVID-19 pandemic. However, since the introduction of widespread global vaccination programs, correlations have not only declined, but even moved lower than the levels observed before the pandemic.
As a reminder, market correlations are typically expressed as a number between negative one and positive one.
So when two underlyings are positively correlated—meaning they move in the same direction—the correlation will range between zero and one. And when two securities are negatively correlated—meaning they move in opposite directions—the correlation will range between negative one and zero.
If no correlation exists between two securities, then the relationship is usually described as “zero” correlation. And if a given correlation is exactly negative one or positive one, it is generally referred to as a “perfect negative correlation” or “perfect positive correlation,” respectively.
Aside from those categorizations, correlations can also be characterized as weak, semi-strong, or strong, depending on the degree to which a given two underlyings are linked.
For example, 0.15 might be considered a “weak positive correlation,” whereas 0.75 might be considered a “strong positive correlation.” On the other hand, -0.20 might be considered “weak negative correlation,” while -0.80 might be referred to as “strong negative correlation.”
In the case of gold and silver, the long-term average correlation between these two metals is roughly 0.89, which is why their relationship is typically characterized as a strong, positive correlation.
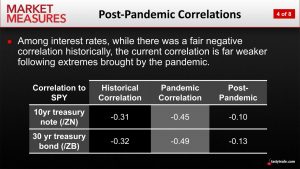
As one can see in the slide below, correlations across interest rate-related products have also shifted significantly during the past 18 months.
Investors and traders tend to flock to the safety of bonds during market crises, which is why a semi-strong negative correlation has historically existed between bond prices and the stock market. And, as highlighted in the data below, that relationship also intensified during the “corona crisis.”
The above data provides further confirmation of just how drastically correlations can vary across different market environments.
The complete analysis on market correlations conducted by tastytrade was presented recently on a new installment of Market Measures. Readers seeking to learn more about how correlations have shifted during the market rebound may want to review the complete episode when timing allows.
Investors and traders often use correlation data to identify potential trading opportunities, and to assist with portfolio and risk-management decisions, such as:
- diversifying holdings in the portfolio
- diversifying strategies in the portfolio
- hedging the portfolio
- risk managing changes in correlation
Market participants looking for more information on the above bullet points may also want to review this previous episode of Options Jive on the tastytrade network.
For updates on everything moving the markets, readers can also tune into TASTYTRADE LIVE—weekdays from 7 a.m. to 4 p.m. CST—at their convenience.
Sage Anderson is a pseudonym. He’s an experienced trader of equity derivatives and has managed volatility-based portfolios as a former prop trading firm employee. He’s not an employee of Luckbox, tastytrade or any affiliated companies. Readers can direct questions about this blog or other trading-related subjects, to support@luckboxmagazine.com.