S&P Changes as it Soars
The S&P 500 Index surpassed 3,000 for the first time on July 10, giving bullish investors across the nation cause to rejoice. The bears, on the other hand, cringed and licked their wounds, which never seem to heal this year.
But regardless of whether they felt elation or despair, investors marveled at the breakthrough into the 3,000 range. That level marks a 350% rally in the index since the lows of the recession a decade ago.
Still, the meteoric rise in the index has not been without its share of changes. Let’s rewind further to demonstrate how the top components of the S&P 500 have evolved over the last 30 years.
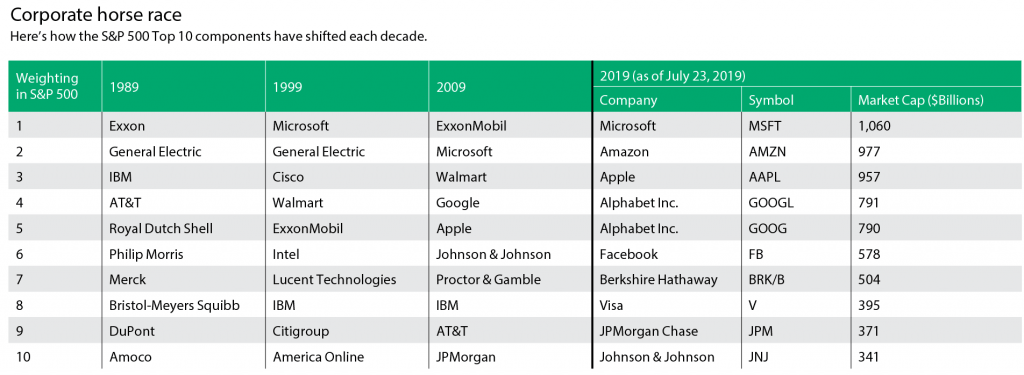
The table shows how the S&P 500 Top 10 components have shifted each decade. In 1989, four of the top 10 companies were oil giants, with Exxon (XOM) holding the top spot. Meanwhile, General Electric (GE) held second place and did so again in 1999, which seems hard to believe today because GE currently ranks 68th in the index.
By 1999, Microsoft (MSFT) had cemented its place at Number 1, the same spot it holds today. America Online—now a division of Verizon (VZ)—crept into the Top 10 in 1999 before merging with Time Warner in 2000.
By 2009, Google, a.k.a. Alphabet (GOOGL) and Apple (AAPL) had mounted the stage. Apple successfully launched the iPhone in 2007 and made the Top 10 two years later.
By this year, tech companies dominated the Top 10. In previous decades, the Top 10 had come from a mixed bag of sectors. This summer, the Top Five companies (actually the Top Six stocks because of Alphabet’s two share classes) now represent more than $5 trillion of the S&P’s Index value.
But does all this matter? After all, the S&P represents 500 companies in an intelligent, market-cap weighted index. Well, consider the following:
The Dow Jones Industrial Average will always have a special place in investors’ hearts; it was the barometer of the U.S. stock market for decades. However, it’s now often ignored because of its archaic price-weighted calculation. A price-weighted index assigns higher weightings based on a company’s stock price, instead of the value of the company.
For example, safety concerns and negative headlines aside, Boeing’s stock price remains above $360. That makes it the largest component of the Dow Jones because it’s the most expensive stock. Boeing now represents 9% of the index value. In reality, Boeing is the 20th largest company (by market capitalization) of the 30 companies in the Dow.
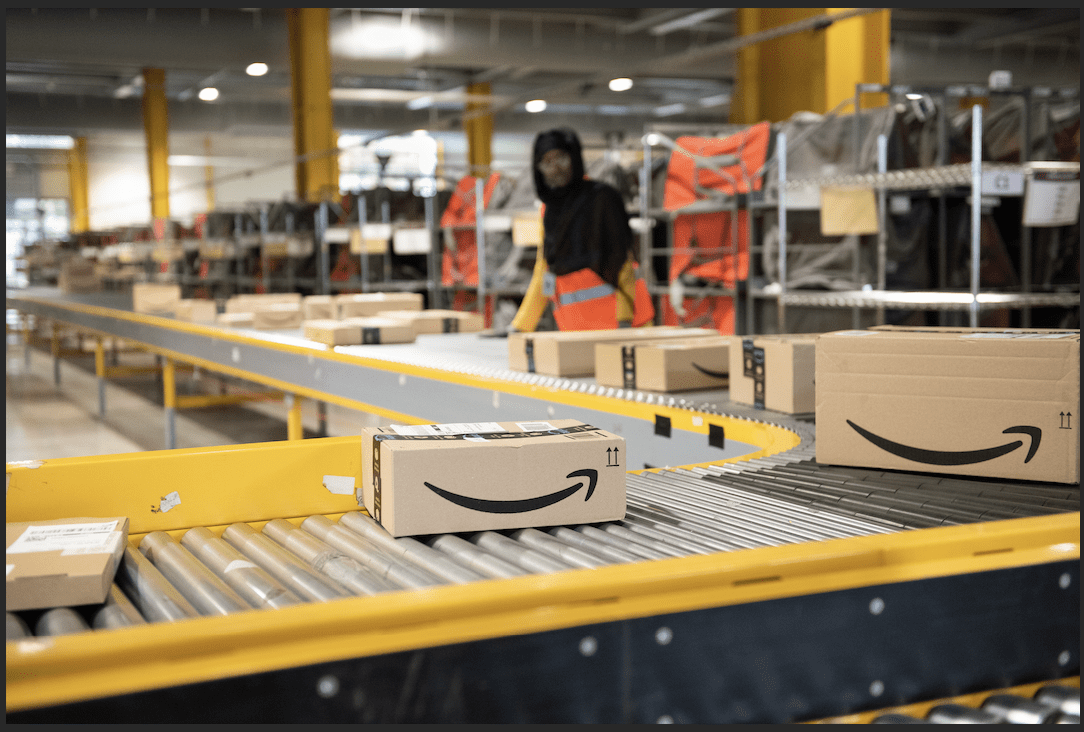
With the S&P 500, a capitalization-weighted index, the companies with the greatest value are the highest-weighted, and their price movement has the most impact on the index. With the five tech giants holding the top spots, large moves in those stocks have a huge impact on the index. Microsoft, Amazon (AMZN), Apple, Alphabet and Facebook (FB) represent 18.8% of the entire S&P 500’s value.
This tech-heavy concentration has far-reaching effects because of the numerous ways countless investors and traders have exposure to the S&P 500, including ETFs, options, futures and mutual funds. Regardless of preferred asset type, all who invest in the S&P have a roughly 18.8% exposure to these stocks.
Some investors may feel comfortable with that exposure and are willing to ride out a pullback in the market that could lead to a shift in the weightings. Others may feel more defensive. One way to minimize exposure would be to invest in sectors like energy and utilities, which respectively constitute only 4.9% and 3.3% of the S&P.
Quiet Foundation’s free portfolio analysis tools indicate that the Top Five tech stocks underperformed the S&P 500 Index as a whole over the last three months, +2.2% versus +2.7%. Advanced traders may be looking to reduce or eliminate the exposure of these stocks in their index holdings. They could potentially achieve that by selling defined, lower-risk call spreads in the individual stocks, relative to the size of the index exposure.
The hypothetical scenario of removing these stocks from the index holdings, again run through Quiet Foundation’s system, does lower the internal portfolio correlation of the index holdings. Thus, the overall risk of loss in a market downturn could theoretically be lower.
When the S&P 500 hit 3,000 for the first time, it served as a reminder to check under the hood to see what the index is comprised of this year. Whether bullish or bearish, investing or trading, investors should remain cognizant of the underlying buildup of their chosen assets and, as always, do their due diligence.
James Blakeway serves as CEO of Quiet Foundation, a data science-driven tastytrade subsidiary that provides fee-free investment analysis services for self-directed investors.