Anatomy of a Monster Crypto Rally
Research conducted by tastytrade shows that the top digital coins typically rally between 100-300% over the course of two to three weeks, before correcting or consolidating ahead of the next leg up.

When it comes to monster rallies, the cryptocurrency sector has set a new standard.
Gone are the days when a 100% return on investment was considered a big win. Today, if a coin hasn’t rocked the world to the tune of a couple thousand percent, it’s probably not even on the radar.
For example, check out some of the biggest cryptocurrency gainers in 2021, with market capitalizations of at least $1 billion, as of Nov. 10:
- Fantom (FTM) +14,000%
- Telcoin (TEL) +13,000%
- Solana (SOL) +10,500%
- Polygon (MATIC) +10,000%
- Dogecoin (DOGE) +8,700%
- PankcakeSwap (CAKE) +8,000%
- Livepeer (LPT) +6,000%
In comparison to the above, the best performer in the S&P 500 so far this year is Moderna (MRNA), and that stock is up only a paltry 230%.
Considering the mouth-watering figures listed above, it’s no wonder the crypto sector continues to gain steam. And thanks to new research conducted by tastytrade, investors and traders new to the space—as well as experienced hands—now have access to fresh insights on the average crypto rally.
Information that should prove very useful when trading the next big thing.
For context, the total market value of the entire cryptocurrency market is currently closing in on $3 trillion. And of the thousands of digital coins, the five largest by market capitalization are Bitcoin (BTC), Ethereum (ETH), Polkadot (DOT), Chainlink (LINK) and Uniswap (UNI), as illustrated below.

Considering their elite status at the top of the crypto mountain, the five coins highlighted above have experienced their fair share of monster rallies.
But what’s the average crypto rally look like?
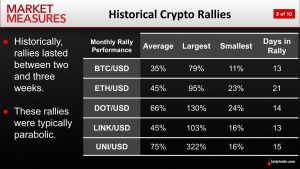
According to the aforementioned research by tastytrade, bullish rallies generally last about two to three weeks, and typically involve a doubling in price. However, as illustrated in the chart below, a large rally can often involve a move much larger than 100%—in the case of Uniswap, it was 322% over the course of 15 days.

Of course, the numbers above don’t reflect the overall return on the five coins since inception, which are astronomic. Instead, the above numbers simply provide insight into how the coins behave during the average rally, prior to a pullback.
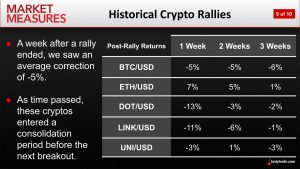
tastytrade research also revealed that in the wake of the average rally listed above, these five coins have typically corrected in value by about 5%, before consolidating (i.e. trading sideways) ahead of the next breakout.
The chart below provides insight into how each of the five coins has tended to perform in the wake of a rally. Aside from a couple of outliers, the figures generally point to an average pullback of about 5%.

It’s important to note that the figures highlighted above don’t necessarily apply to all cryptocurrencies. Coins with lower market caps, and higher associated levels of volatility, don’t necessarily perform in the same fashion during the average rally or pullback.
Obviously, not all coins make it to the top of the mountain, and many fade into the land of irrelevance. But for investors and traders actively involved in the larger market-cap cryptocurrencies, this data should prove valuable—especially as reference points for those that are new to the sector.
For more details on this research, readers are encouraged to review a new installment of Market Measures on the tastytrade financial network. A recent episode of Options Trading Concepts Live is also recommended for those seeking to learn more about trading crypto stocks and futures.
For timely insights on everything moving the financial markets, readers can also tune into TASTYTRADE LIVE—weekdays from 7 a.m. to 4 p.m. CST—at their convenience.
Sage Anderson is a pseudonym. He’s an experienced trader of equity derivatives and has managed volatility-based portfolios as a former prop trading firm employee. He’s not an employee of Luckbox, tastytrade or any affiliated companies. Readers can direct questions about this blog or other trading-related subjects, to support@luckboxmagazine.com.


