Coinbase and 5 Other Key Charts for August
Many investors and traders use price charts to help with idea generation in the financial markets, and as of August 2021 several prominent themes have emerged.

Much like 2020, the 2021 financial markets have kept investors and traders on the edge of their seats. Whether it be record-breaking highs in the major indices, a slowdown in volatility, or a crash in the cryptocurrency sector, there’s been plenty of price action to follow.
Thanks to a new episode of Options Jive on the tastytrade financial network, investors and traders can review some of the most critical stories currently playing out in the markets—documented through a series of price charts.
Not surprisingly, one of those charts involves the CBOE Volatility Index (VIX)—and in particular the latter part of the term structure (i.e. longer-dated VIX futures). Volatility has declined during summer, but as shown in the chart below, investors and traders are clearly expecting a jump in volatility come fall.
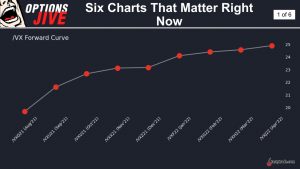
As one can see in the above chart, VIX futures (i.e. expectations for future volatility) increase significantly as one goes further out on the time horizon. While the root of those expectations is unknown, it’s clear that most market participants don’t expect the current bout of “complacency” to last.
The above VIX chart actually dovetails well with previous tastytrade research that outlines how volatility in the financial markets tends to be seasonal. According to historical data, volatility tends to drop in the summer, before picking up again in the fall.
Cryptocurrency Chaos
Moving on, another big story this year has been the Bitcoin correction, which coincidentally happened to play out around the same time as the initial public offering (IPO) of Coinbase (COIN).
Coinbase is of course one of the better-known cryptocurrency trading platforms, producing over one billion dollars in revenue during 2020, and boasting a user base of close to 60 million.
In spring and summer 2021, COIN shares pulled back significantly from their IPO level, and are now trading around $258/share. Due to its close affiliation with the cryptocurrency sector, COIN shares have historically exhibited a strong positive correlation with the price of Bitcoin—the two move together about 71% of the time (on average).
Along those lines, cryptocurrency trading volumes are likewise a key driver for COIN’s business model. And as noted recently by the tastytrade network, cryptocurrency trading volumes have dropped significantly in the wake of the Bitcoin correction.
As highlighted in the chart below, the weakness in Bitcoin has led to choppy trading action in the shares of COIN, as investors with divergent outlooks are clearly grappling with positioning ahead of the company’s forthcoming Q2 earnings report.

Coinbase is expected to report Q2 earnings on August 10, and based on recent activity, the stock could be poised to make a big move.
Investors and traders are no doubt eagerly anticipating that day, as the financial details of COIN’s business operations provide for deeper insights into the overall cryptocurrency trading environment.
Cryptocurrencies have also been in the news this summer due to heightened attention from regulators in Washington D.C. Readers seeking to learn more about the potential for changes in the cryptocurrency regulatory environment may want to review this new interview with the founder of Cardano, Charles Hoskinson.
Treasury Yield Breakdown
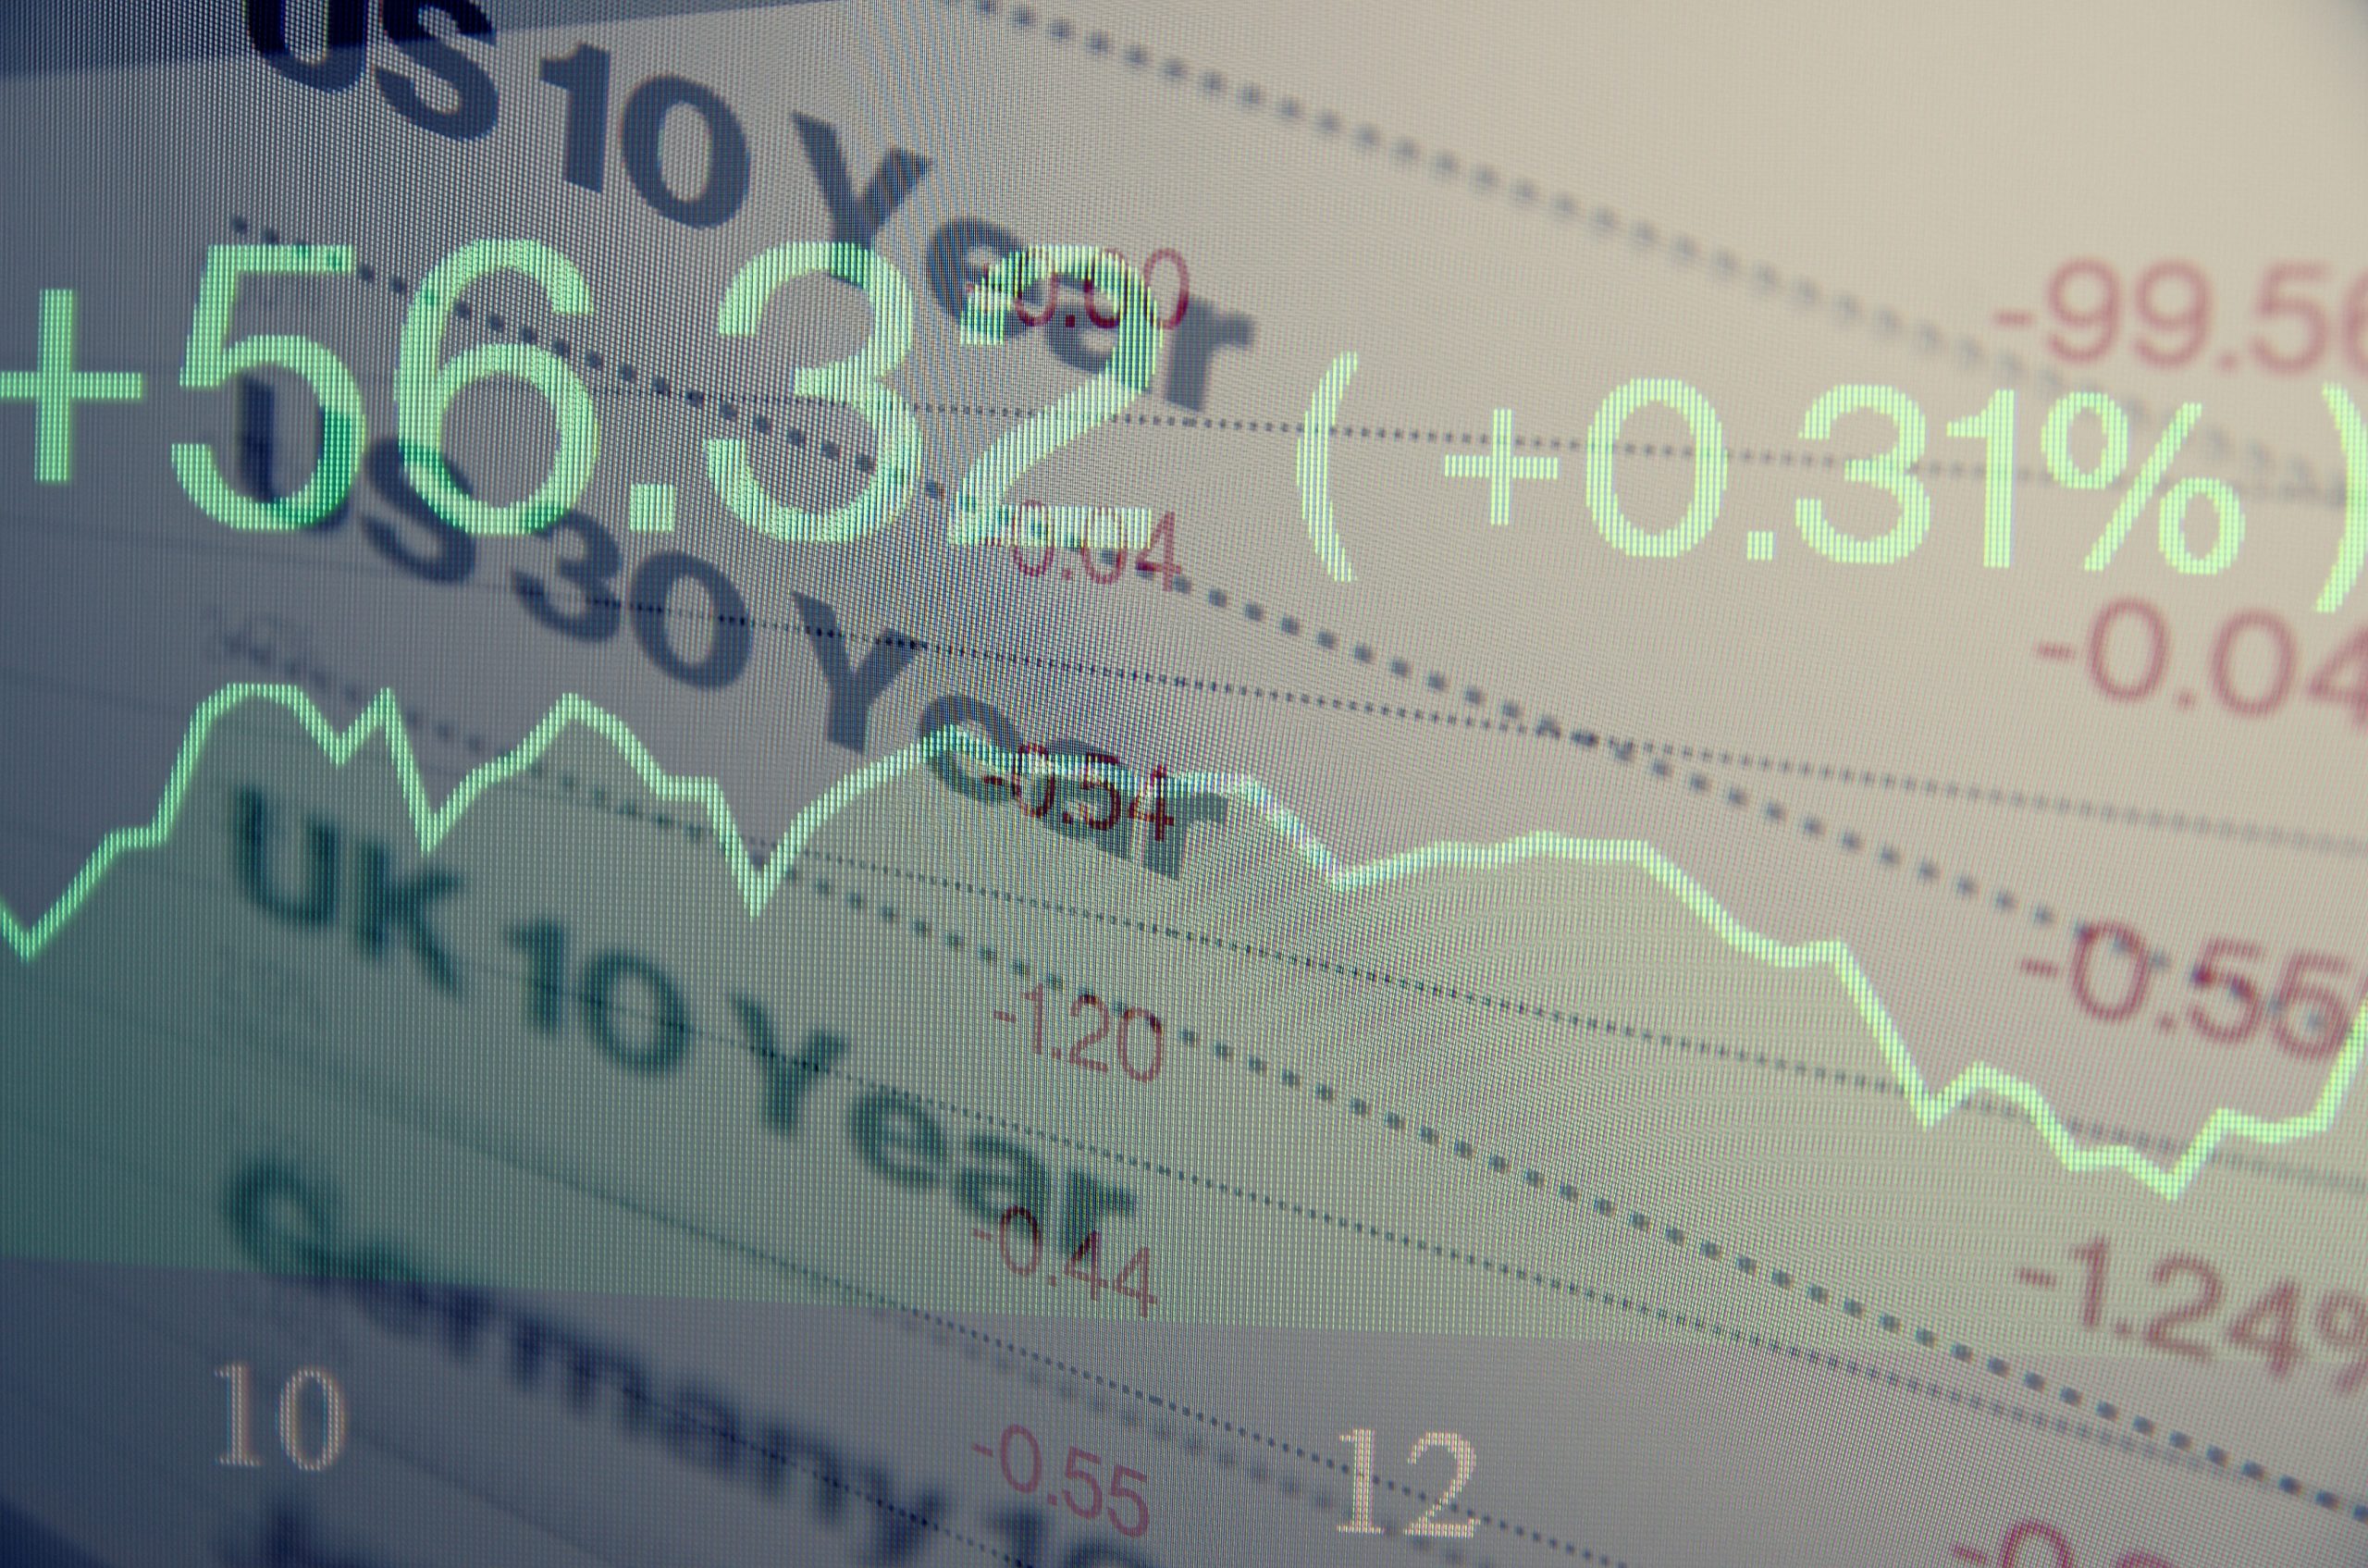
Lastly, but certainly not least, is the interesting breakdown in correlation between the stock market and Treasury yields that has been observed in 2021.
Treasury yields have historically shared a relatively strong positive correlation with overall valuations in the stock market, as was observed when both experienced sharp corrections at the outset of the COVID-19 pandemic in early 2020.
Interestingly, Treasury yields have been dropping in recent weeks as rising caseloads of the coronavirus have started to threaten the nascent global economic recovery. However, the stock market has not yet followed suit.
The chart below highlights the recent drop in yields, despite the fact that overall stock market valuations are sustaining record highs.
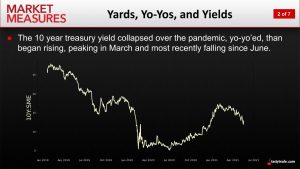
For a detailed breakdown on the traditional relationship between yields and the stock market, readers may want to review a new episode of Market Measures on the tastytrade financial network.
Investors and traders seeking to learn more about reading and interpreting price charts can also tune into Trading Charts with Tim Knight on TASTYTRADE LIVE, weekdays from 2:15 to 2:30 p.m. CST—at their convenience.
Sage Anderson is a pseudonym. He’s an experienced trader of equity derivatives and has managed volatility-based portfolios as a former prop trading firm employee. He’s not an employee of Luckbox, tastytrade or any affiliated companies. Readers can direct questions about this blog or other trading-related subjects, to support@luckboxmagazine.com.