Velocity Dominates: VIX Remains High
Understanding velocity in the markets is key to truly mastering the options/volatility trade.
In the options world, it’s generally accepted that downside puts are more expensive than upside calls because markets have historically crashed more quickly than they’ve rallied.
The additional risk premium observed within downside put pricing is frequently referred to as “volatility skew.”
The events of 2020 have largely confirmed the rationale behind skew, as U.S. market indexes experienced the sharpest ever correction in the shortest period of time, dropping from all-time highs to bear market territory in only 19 trading days during late February and March.
And while the recent rebound has been impressive, it has played out over a much longer period of time (as shown below), which also fits the “skew” pricing model for options/volatility.
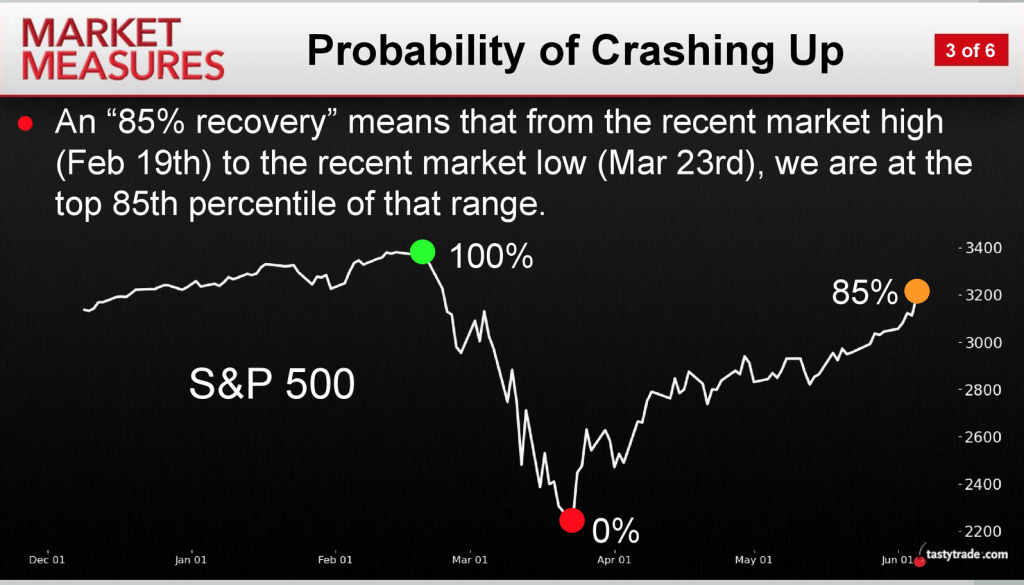
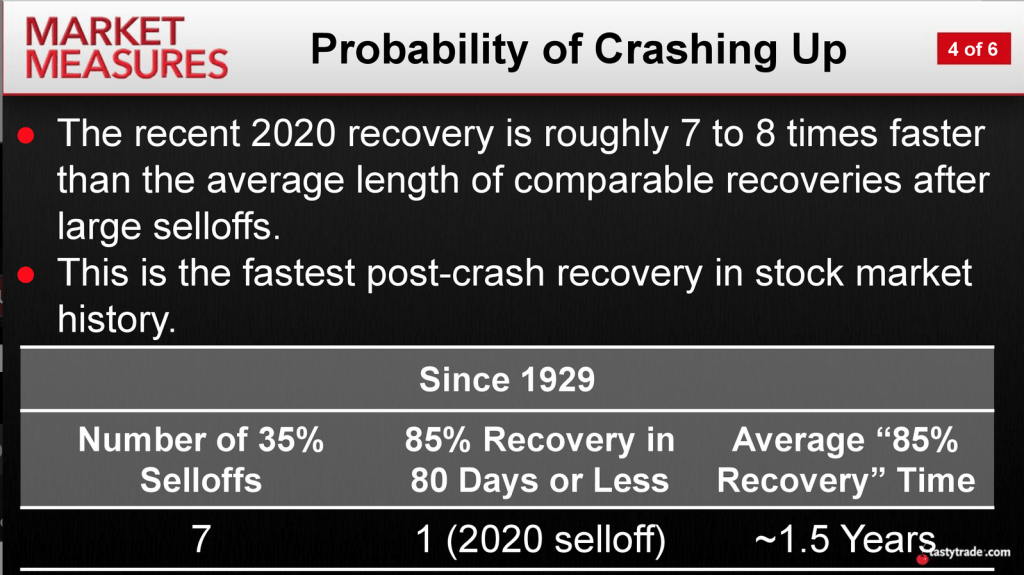
Based on research conducted by tastytrade, the recent rebound has also been much quicker than most in history. In comparison to past episodes of market turbulence, the 2020 rally has played out roughly seven to eight times faster than the average rebound after a crash.
The velocity of the current rebound is highlighted by the fact that the average rally after a steep correction has lasted one-and-a-half years historically, as illustrated below:
Fast-forwarding to the present, equity indexes are bumping close to their all-time highs, but the recent market turbulence can’t easily be forgotten—especially when it comes to pricing volatility for the remainder of 2020 and beyond.
Citing previous research conducted by tastytrade, historical data indicates that for every 1% move down in the S&P 500, implied volatility has risen about 0.81 points on average, and for every 1% move higher in the S&P 500, implied volatility has declined by 0.62 points on average.
That slower rate of decline in implied volatility as equity markets have historically rebounded also helps explain why the VIX remains above 30 at this time—well above its historical average of 19—despite the fact that equity indexes are nearly back to where they started before the correction.
Given that the 2020 market has seen the fastest crash, and fastest associated rebound in market history, it actually seems somewhat appropriate that options prices should continue to hover at higher-than-average levels. The market is still moving “quickly,” even if the overall trend has been higher.
The current paradigm is punctuated by the following key volatility statistics:
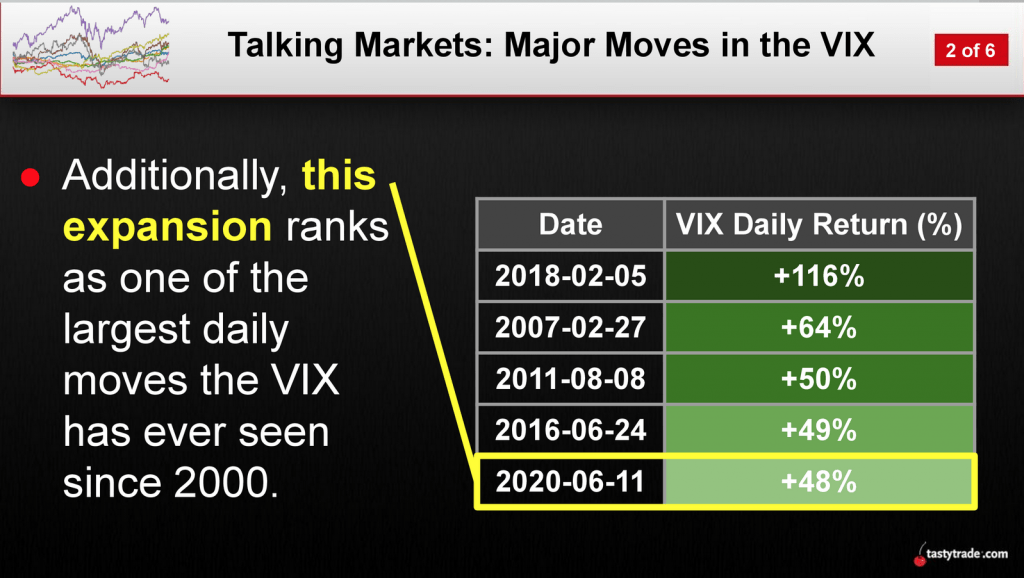
On June 11, when the S&P 500 dropped 6%, the VIX spiked by 48% in a single session—the metric’s fifth largest one-day move in the current century. That also makes it the largest single-day pop in VIX during 2020, which is also notable, as highlighted below.
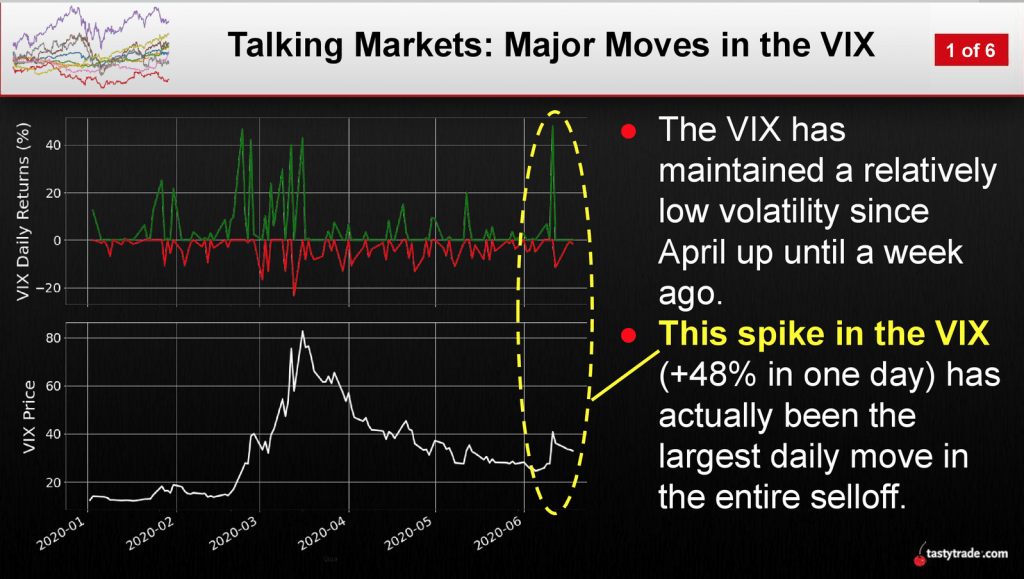
The above tells us that options prices are still very sensitive—further confirmation that heightened absolute levels in the VIX are appropriate in the current environment.
Investors and traders deploying options-focused positions should therefore be especially careful at this time, and may want to consider other products in the market (i.e. bonds, currencies and precious metals) that are exhibiting less actual volatility but still offer elevated levels of implied volatility.
For additional information on market velocity in the current environment, readers may want to review these recent episodes on the tastytrade financial network:
- Tasty Extras: Major Moves in the VIX
- Market Measures: Probability of Crashing Up
- Tasty Extras: 2020 Market Stats
Sage Anderson is a pseudonym. The contributor has an extensive background in trading equity derivatives and managing volatility-based portfolios as a former prop trading firm employee. The contributor is not an employee of luckbox, tastytrade or any affiliated companies. Readers can direct questions about any of the topics covered in this blog post, or any other trading-related subject, to support@luckboxmagazine.com.