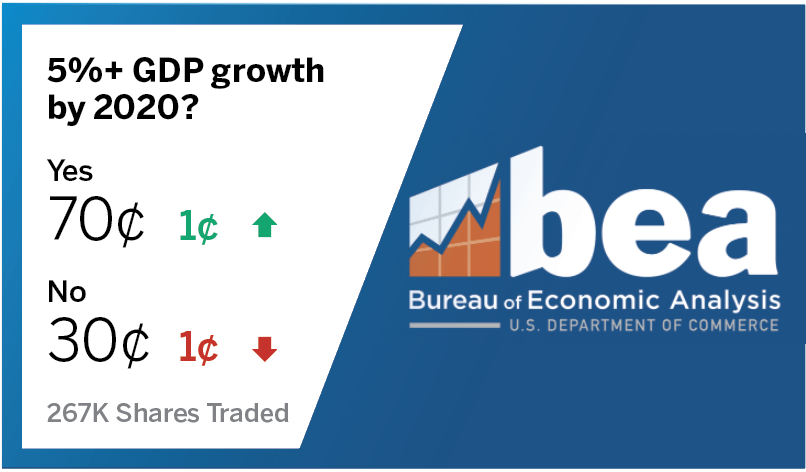
5% Growth? Bet on it.
How does this seem possible? Read the fine print.
The last time the American economy grew by a quarterly rate of 5% or more was in the third quarter of 2014, thanks partly to consumer spending that rose at an annualized rate of 3.2%. Job growth for the year was stronger than it had been for well over a decade.
Fast-forward to 2020, and the COVID-19 crisis is menacing the nation’s health and ravaging the economy. So why would it make sense to bet in the prediction markets that the nation would achieve a 5% or greater GDP growth rate by the end of the year?
PredictIt’s “Will the U.S. economy hit 5%+ GDP growth by year-end 2020?” market is a slam dunk YES (contract), but it’s trading in the mid-to-low 70¢ range (suggesting a 70% probability of occurring) and has been for a while.
What gives? How could an economy mired in post-crisis sub-3% growth doldrums possibly break out to such an extent in the midst of global pandemic?
In this case, the value flows from market participants’ confusion over what constitutes a YES or a NO outcome. As originally written, the contest rules were so opaque that PredictIt had to issue a supplementary comment. The clarification stipulates the market will be resolved as measured by “annualized, seasonally adjusted, real quarter-over-quarter growth in GDP” and subsequently reported by the Bureau of Economic Analysis (BEA).
So how does the fine print render what appears at first glance to be a sure loser of a trade into a clear-cut YES? Let’s refer to the rules clarification: It say it measures “annualized, seasonally adjusted, real quarter-over-quarter growth in GDP.”
Since the quarterly growth will be annualized, that 5% headline growth target is a bit misleading. A 5% annualized growth rate is equivalent to about 1.23% of quarterly growth. Furthermore, this reflects quarter-over-quarter instead of year-over-year growth. Whereas year-over-year growth compares a given quarter to the corresponding quarter one year earlier, quarter-over-quarter growth simply compares consecutive quarters. In a year-over-year measure, Q3 of 2020 would be compared to the halcyon days of Q3 2019.
Since the metric is quarter-over-quarter, growth in Q3 2020 real GDP will be measured against a baseline of the social-distancing hellscape of Q2 2020. In light of Q2 2020 forecasts of economic contraction to the order of roughly 30% annualized—and the BEA’s initial 2020 Q1 estimate of a huge 4.8% jump—to satisfy a YES in this market all that needs to happen is for Q3 2020 to be a 1.23% or better improvement in real GDP over the low of Q2 2020.
With a massive fiscal and monetary stimulus already announced—and additional relief continuing to take shape—this market appears to be a gimme YES.
Though black swan paths in this market could resolve NO, and while the holding period might be a little longer than optimal for some prediction market traders, there’s still more than enough value here to make the money printer “go brrr.”
Always read the fine print.
Prediction Market Pricing
The 70¢ pricing in this market equates to the market constituents’ projection of a 70% probability that the market will resolve YES. The binary option pricing model means the contract will trade between 1¢ and 99¢, and correct market contracts will expire at the full value of $1. In this instance, a contract purchased at 70¢ expiring at $1 approximately six months later yields a return of 43% and an estimated annualized return on investment of 104%.
Byron Druthers is the pen name of a registered representative of a Wall Street firm who asked that we not disclose his political trading. He contacted Luckbox as a listener to the magazine’s podcast, The Political Trade.

Want insight into wagering on political prediction markets? Check out Luckbox’s The Political Trade wherever podcasts are available. Weekly episodes feature top PredictIt traders and political insiders, such as Anthony Scaramucci and James Carville.