Three Things to Watch with Interest Rates Surging
Benchmark interest rates have surged to a 22-year high in the U.S. Investors should be closely monitoring this niche of the financial markets.
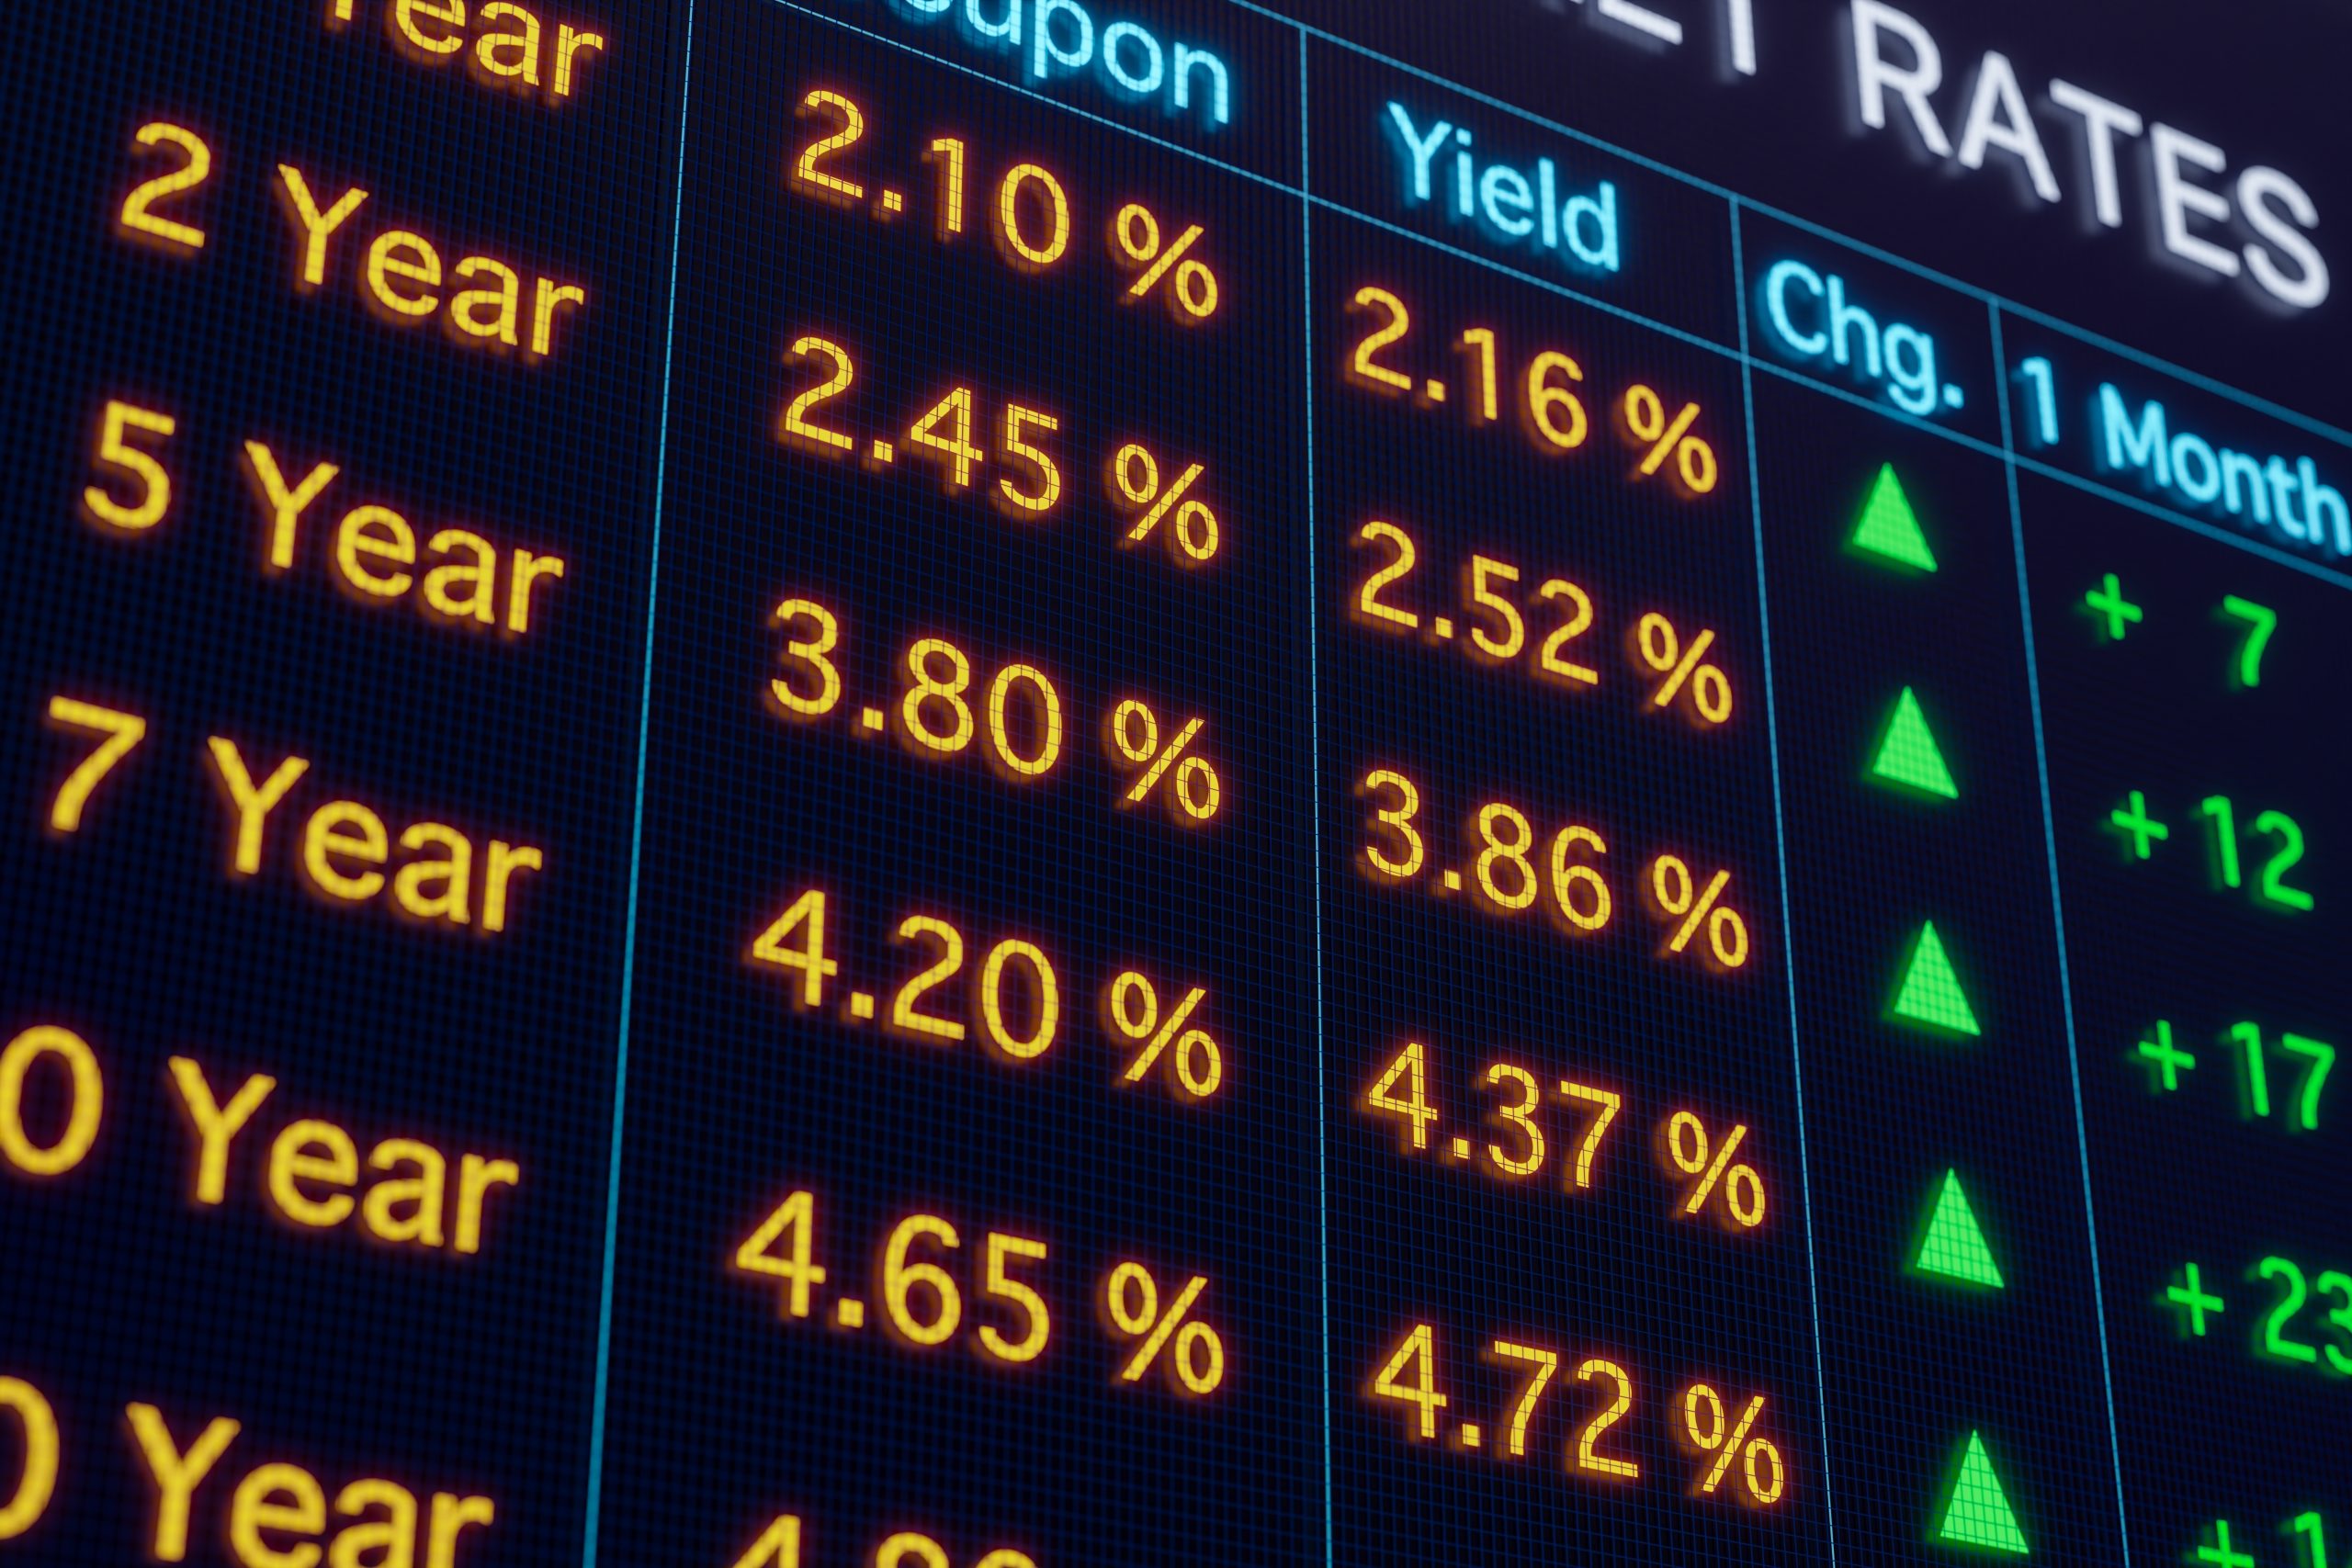
- Benchmark interest rates are currently sitting at a 22-year high in the United States, with a target of 5.25-5.50%.
- Currently, interest rates markets are projecting that the Federal Reserve will not raise rates again at that meeting.
- The next meeting of the Federal Reserve is scheduled for September 19-20.
Prevailing interest rates have been one of the biggest stories in the global financial markets during the last three years, and with benchmark rates recently surging to 22-year highs, they will continue to be for the foreseeable future.
Along those lines, the next two meetings of the Federal Reserve are scheduled for Sept. 19 and 20, and after that, from Oct. 31 to Nov. 1.
Currently, the interest rates market is projecting that the Federal Reserve will hold rates steady during the September meeting, according to data compiled by the CME Group. The interest rates market is projecting an 80% chance that benchmark rates remain at 5.25-5.50% through the September meeting.
Additionally, CME data indicates that only 20% of market participants currently think the Fed will raise rates at the October meeting.
Only time will tell if those projections come true, but in the meantime, investors and traders can follow three key barometers to keep their fingers on the pulse of the interest rates market.
It’s important to note that these expectations are dynamic, and could change at any time. For the time being, however, that information has to be somewhat comforting for investors and traders—not to mention corporate and individual borrowers.
Tracking Stress in the High-Yield Debt Market
One key barometer to follow in the interest rates market is the high-yield debt market. High-yield debt generally refers to bonds that are rated below investment grade by credit ratings agencies.
As implied by their lower ratings, these instruments possess more risk than their investment-grade counterparts.
When headwinds develop in the economy, market analysts closely monitor the performance of high-yield debt instruments, because the first signs of stress in the financial system often come from the high-yield niche. Along those lines, Matthew Gelfand—an executive director at Tricolor Capital Advisors—recently told CNBC, “Default rates tend to increase as the economy slows.”
Looking at the ICE BofA U.S. High Yield Index (effective yield), one can see that the index typically peaks when the economy and financial markets are under extreme duress, like during the onset of the COVID-19 pandemic, as illustrated below.
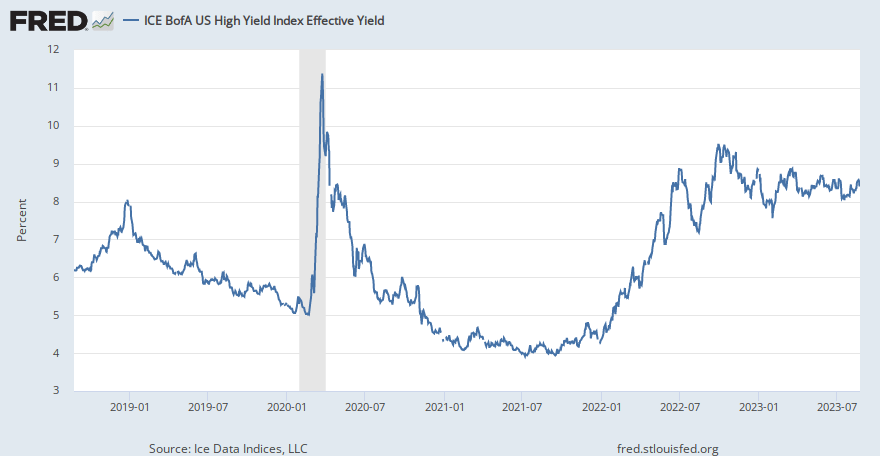
As highlighted in the above chart, the ICE BofA U.S. High Yield Index has been trending higher since the start of 2022, and is currently trading at about 8.4%.
For reference, the index peaked at roughly 21.80% during the 2008-2009 Financial Crisis, and surged above 11% during the onset of the COVID-19 pandemic.
As a result, this gauge can be an excellent reference for investors and traders seeking to track stress in the financial system—especially amidst a 2023 surge in corporate bankruptcies and defaults.
The Ever-Changing Yield Curve
When it comes to U.S. interest rates markets, the yield curve is another key source of information.
The yield curve depicts interest rates over time—short-term, medium-term, and long-term. And when the yield curve is upward-sloping over time, that generally implies that the underlying economy is “healthy.”
On the other hand, when the yield curve is downward sloping (i.e. short-term rates are higher than long-term rates), that implies the market is expecting the Federal Reserve to lower benchmark interest rates at some point in the future. The Fed usually cuts interest rates to accommodate the economy when it hits a rough patch.
When the yield curve is aligned in this fashion, it’s referred to as an “inverted” yield curve.
And that’s precisely how the yield curve has been aligned since last summer. Currently, the yield on the 2-year U.S. Treasury bond is 5.08%, while the yield on the longer-dated 10-year U.S. Treasury bond is 4.23%.
That means the current spread between the 2s and 10s is 85 basis points (5.08% – 4.23% = 0.85%, or 85 basis points), which is more severe than some other recent inversions of the yield curve, as highlighted below.
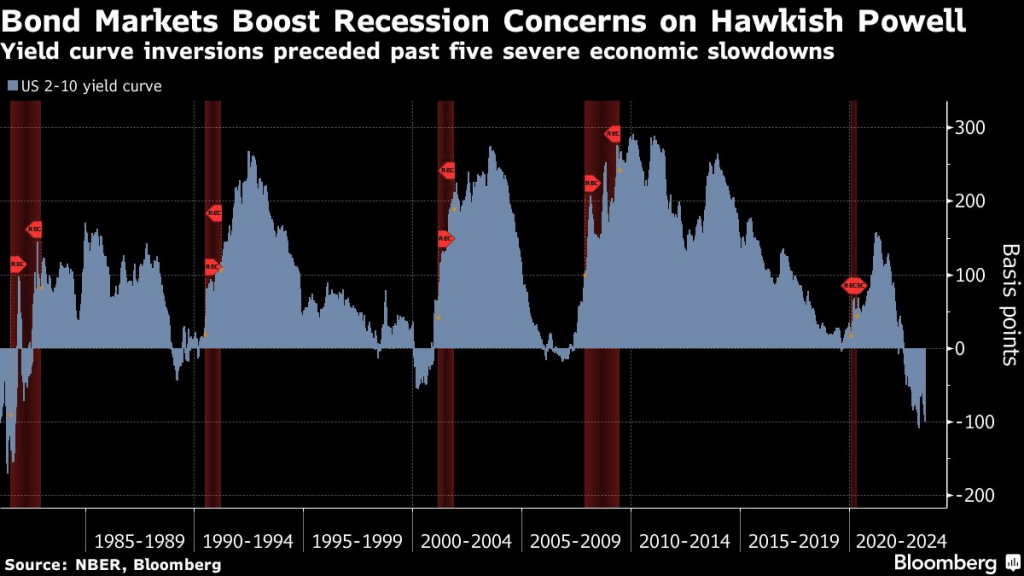
In the last 40+ years, every major U.S. economic recession has been foreshadowed by a similar inversion of the 2s and 10s. And while historical performance (or a historical pattern) is no guarantee of future performance, this is clearly a key aspect of the interest rates market to monitor in the coming months
If the yield curve were to invert more sharply—from 85 basis points to 100 basis points—that could indicate that the likelihood of a recession is increasing, at least in the eyes of interest rates traders.
On the other hand, if the yield curve were to flatten—from 85 basis points to 50 basis points—that could indicate that the traders are ratcheting back their recession expectations.
For this reason, investors and traders would be wise to monitor the ever-changing yield curve during the second half of 2023.
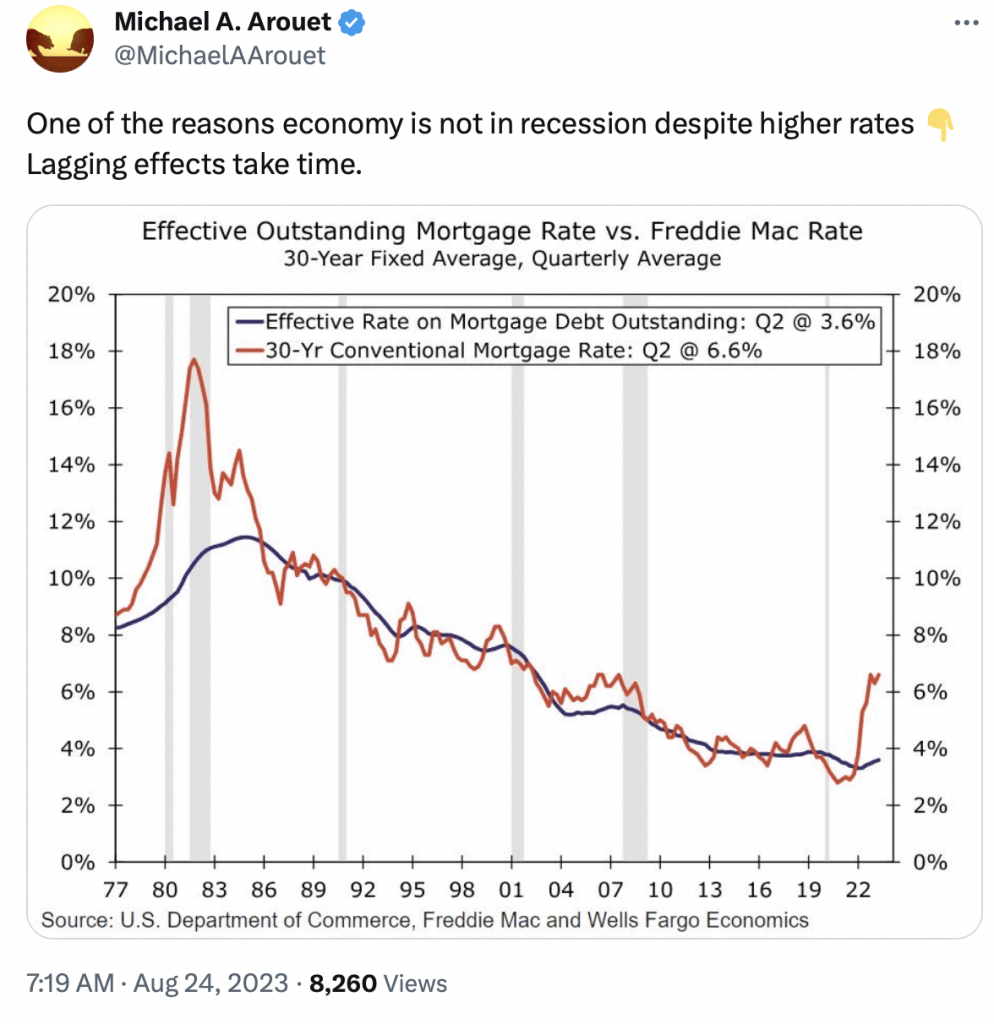
The Lagging Effect of Higher Interest Rates
The U.S. economy was widely expected to enter a recession in H1 2023, but has thus far avoided that fate. Most experts now predict that a recession could develop at some point in 2024.
And the delay appears to be linked to the theory that higher rates don’t take effect until well after they’ve been raised—the so-called “lag” effect.
Looking back at the Fed’s path to higher rates, one can see that from April through September of 2022, interest rates rose from near-zero percent to about 2%. But interest rates were at about 2% before the pandemic started. Accordingly, one could argue that raising rates from zero to 2% wasn’t particularly onerous for the economy.
However, from October of 2022 through March of 2023, benchmark rates increased from 2% to about 4.60%, which likely represents the period in which higher interest rates really started to bite into the economy.
The last time benchmark rates were above 4.50% was back in 2007, immediately preceding the 2008-2009 Financial Crisis.
According to the lag theory, the impact of higher rates doesn’t necessarily appear in the economy until many months later. For example, in a January 2023 speech at the Council on Foreign Relations, Federal Reserve Governor Christopher Waller estimated that in the modern era, the lagging impact of higher interest rates tends to be “nine to 12 months.”
Based on the aforementioned information, that means a recession could materialize at some point in the not-so-distant future. However, projecting when that recession might arrive is a more complicated endeavor. It all depends on how “high rates” are defined.
Did rates get exorbitantly high in March, when they rose above 4.50%? Or not until May, when they surged past 5.00%?
Based on the first scenario, a recession could theoretically emerge 9 to 12 months later, which would fall somewhere between December of 2023 and March of 2024. Based on the second scenario, a recession could theoretically emerge between February of 2024 and May 2024.
The difficulty in predicting when a potential recession might arrive—if at all—is further evidenced by the wide-ranging recession forecasts released by some of the country’s leading financial institutions.
For example, analysts at JPMorgan Chase (JPM) recently rescinded their recession forecast for 2023, and haven’t yet pinpointed when a recession could emerge in 2024.
Along those lines, the country’s second-largest asset manager—Vanguard—projects that the U.S. economy will experience “a shallow recession in 2024,” but hasn’t specified when that might occur. And according to a recent analysis by Citibank (C), a U.S. recession may not materialize until the end of 2024.
For investors and traders, the onset of a recession can be monumental, because recessions have historically triggered corrections in the financial markets. Or, stated differently, recessions/depressions have often been accompanied by corrections in the financial markets.
Going back to 1946, there have been 12 major bear markets in the United States stock market, and 10 of those 12 were accompanied by recessions/depressions.
As a result of the strong link between recessions and market corrections, investors and traders would be well-advised to track the lagging impact of elevated interest rates on the economy during the next 6-12 months.
For more background on the interest rates markets, readers can check out this installment of In This Economyon the tastylive financial network. To follow all the latest updates in the financial markets, readers can also tune into tastylive, weekdays from 7 a.m. to 4 p.m. CDT.
For daily financial market news and commentary, visit the News & Insights page at tastylive or the YouTube channels tastylive (for options traders), and tastyliveTrending for stocks, futures, forex & macro.
Trade with a better broker, open a tastytrade account today. tastylive, Inc. and tastytrade, Inc. are separate but affiliated companies.
Andrew Prochnow has more than 15 years of experience trading the global financial markets, including 10 years as a professional options trader. Andrew is a frequent contributor Luckbox Magazine.