Trading the VIX and VVIX Amid the Latest Banking Crisis
With fear seeping back into the financial markets, investors and traders can use metrics like the VIX, VVIX and VVIX/VIX ratio to track and trade market volatility
As of now, it’s impossible to predict where the current banking crisis may go.
Will the damage be relegated to a couple of regional banks? Or will the global financial system face a broader crisis of confidence, like the one that played out during 2008 and 2009?
We don’t know, but one thing is certain. The massive upside call volume that first appeared in the CBOE Volatility Index (VIX) in mid-February is now starting to look more conspicuous. Right around Valentine’s Day, someone started building a huge stake in 50-strike VIX calls that expire in May.
At that time, few were expecting the VIX to trade above 50 in H1 2023. After all, the VIX hasn’t traded above 40 for nearly three years. Not even the 2022 invasion of Ukraine by Russia was enough to push it above that key level.
Today, however, the possibility of a 50-print in the VIX is looking a lot more reasonable—even if the overall likelihood still feels low.
In the wake of the recent Silicon Valley Bank implosion, the VIX climbed from roughly 19 to just over 26, and is now trading at roughly 25. Looking back at 2008-2009, the VIX behaved in a similar fashion during the early stages of that banking crisis, as well.
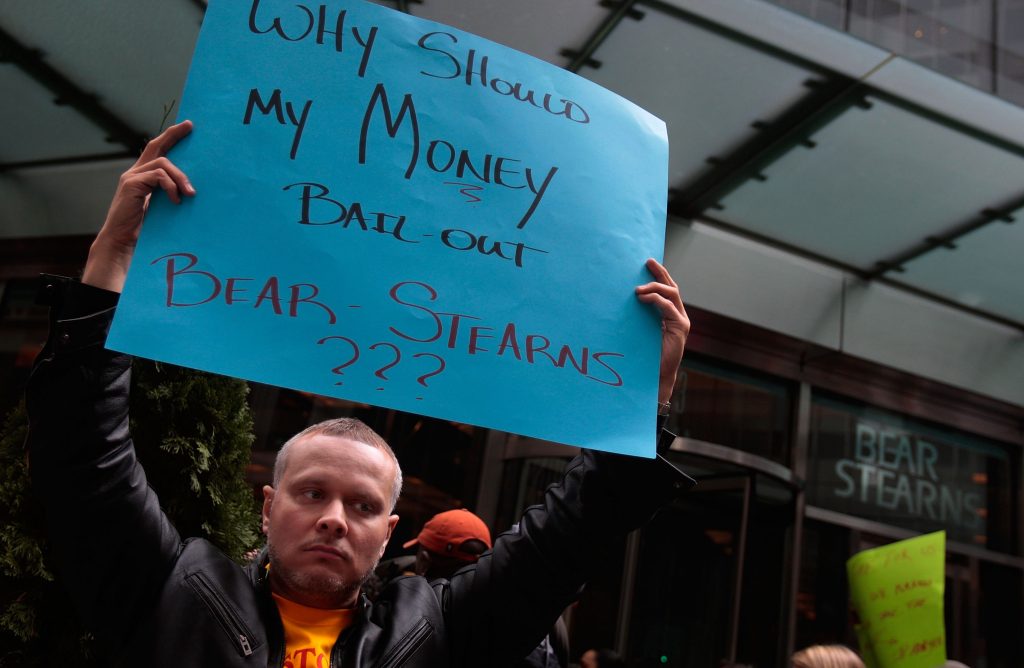
In 2008, one of the first major banks to bust was Bear Stearns, which was ultimately acquired by J.P. Morgan Chase (JPM) for $2/share. Only days before that, the VIX was trading 25.
Immediately after Bear Stearn’s implosion, the VIX spiked to about 32. However, by April 1, 2008, the VIX had retraced back down to 23.
It wasn’t until September of 2008—after several additional bank failures—that the VIX started to explode higher. On Sept. 11, 2008 the VIX closed trading around 24. But by late October 2008 the VIX was setting fresh all-time highs, closing for above 80 for the first time in history on Oct. 24.
Back in the fall of 2008, the global financial system was engulfed in chaos.
Lehman Brothers had failed, and had not been rescued. The world’s stock markets were unhinged, moving as much as 10% in a single day. Over the course of just five trading days (Oct. 6 to Oct. 10) the S&P 500 fell by more than 20%.
On Oct. 24, 2008—the same day the VIX surged above 80—the deputy governor of the Bank of England Charlie Bean said, “This is a once in a lifetime crisis, and possibly the largest financial crisis of its kind in human history.”
Does that mean that something similar will play out in 2023? The odds are against it.
But with two major U.S. banks failing in a matter of days, and Credit Suisse (CS) seemingly circling the drain, it’s probably a good time to tighten one’s approach to risk management.
For context, the only times in history that the VIX closed above 80 were during the 2008-2009 Financial Crisis, and during the onset of the COVID-19 pandemic in 2020.

Looking beyond the VIX
When it comes to tracking and trading market volatility, the VIX isn’t the only game in town.
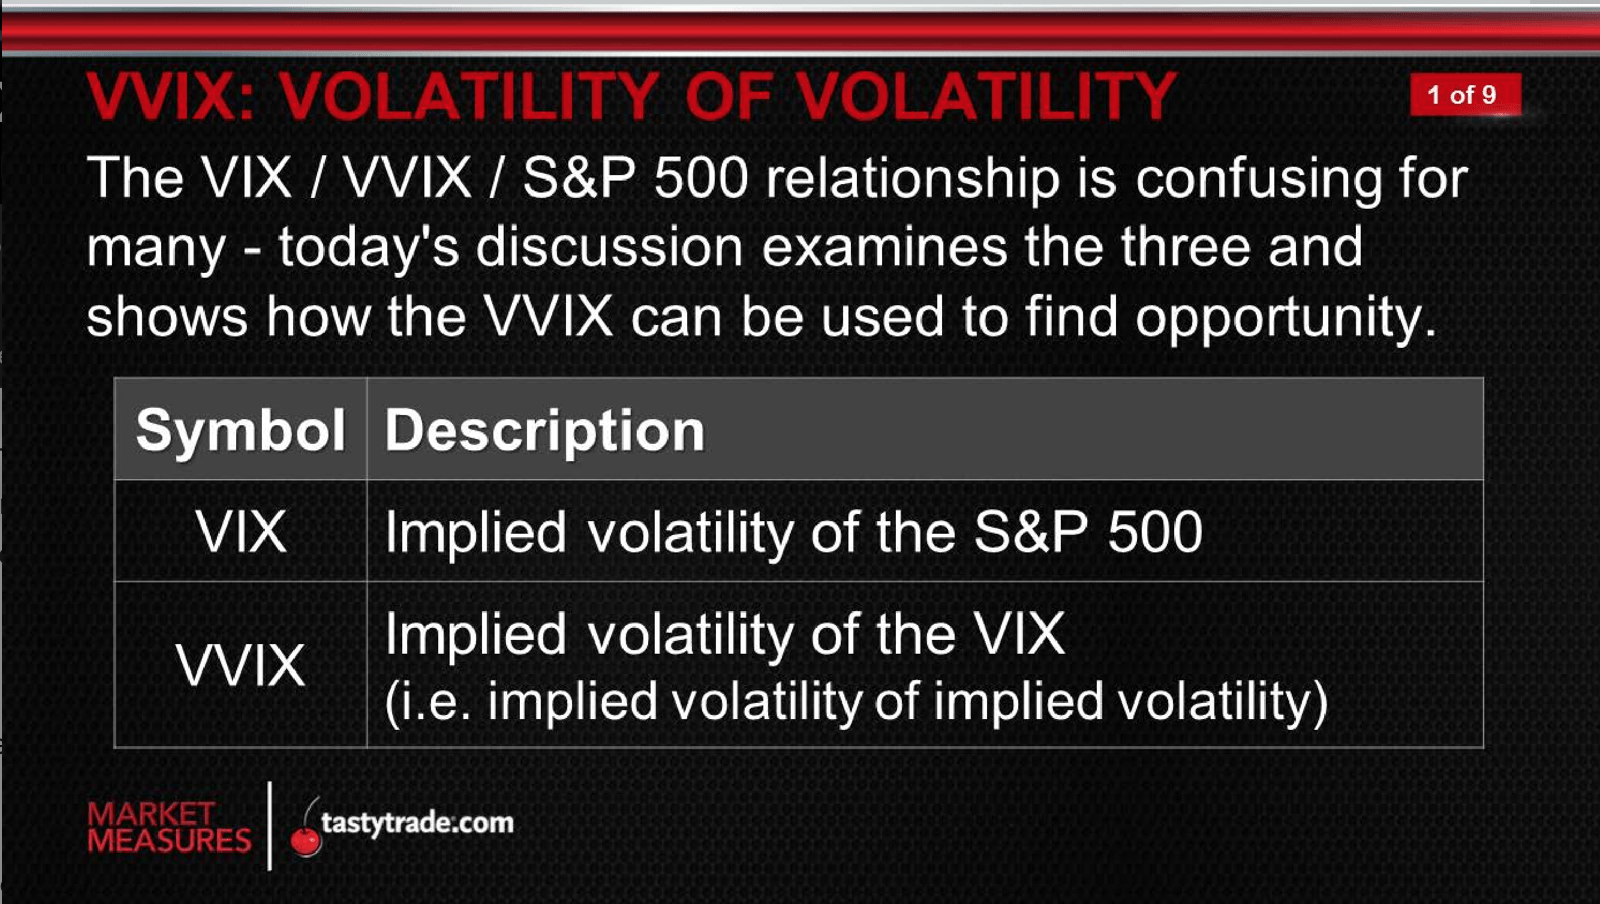
There are plenty of other volatility metrics that market participants can monitor to glean additional insight into the current trading environment. And one of those metrics is the CBOE VIX Volatility Index (VVIX), which is often referred to as the VIX of VIX.
The VIX is calculated using the implied volatility of options in the S&P 500. As prices in S&P 500 options increase, so too does the VIX—and vice versa.
On the other hand, the VVIX is calculated using the implied volatility of options in the VIX itself. So as implied volatility rises in VIX options, so too does the VVIX. That is why the VVIX is said to measure the volatility of volatility, or vol of vol.
The VIX historically ranges between roughly 10 and 90, while the VVIX traditionally ranges between about 70 and 190. And when the VIX and VVIX are at the higher ends of their respective historical ranges, that’s typically an indication that fear has taken hold in the financial markets.
The image below highlights how the VIX and VVIX both spiked during the onset of the COVID-19 pandemic, in early 2020.

In addition to tracking absolute levels in the VIX and VVIX, many investors and traders also track the ongoing relationship between the two, namely the VVIX/VIX ratio. The VVIX/VIX ratio historically ranges between roughly 2 and 10.
Interestingly, it’s actually a low number in the VVIX/VIX that can signal trouble is brewing in the markets.
For example, during the onset of the COVID-19 pandemic, the VVIX/VIX ratio dipped all the way down to 2.5 (VVIX/VIX = 207/82 = 2.5). That level was observed in March 2020, when fears over the rapid spread of COVID-19 pushed the major stock market indices down toward their lows of the year.
On the other end of the spectrum, the VVIX/VIX ratio typically rises to 8 and above when complacency takes hold in the financial markets. For example, in October 2017, the VIX sunk down to 9.19—one of its lowest closing levels in history. On that day, the VVIX/VIX ratio was 10 (VVIX/VIX = 91/9 = 10).
These examples highlight how different levels in the VVIX/VIX can be illustrative of the broader trading environment.
Currently, neither the VIX nor the VVIX is screaming toward record highs. As of mid-March, the VIX is trading 25, while the VVIX is trading about 123. Both are hovering right around their long-term averages.
However, the current reading in the VVIX/VIX ratio suggests that risk in the financial markets may be higher than indicated by the individual readings in VIX and VVIX.
To wit, the VVIX/VIX ratio currently sits at roughly 4.7 (VVIX/VIX = 123/26 = 4.7). That level indicates that anxiety in the financial markets is somewhat higher than what’s implied by the VIX alone.
Investors and traders may therefore want to monitor not only the VIX in the coming days and weeks, but also the VVIX and the VVIX/VIX ratio.
The perspective afforded by these three metrics should provide investors and traders with additional insight into the ever-changing risk paradigm on Wall Street and potentially serve as an early warning if the current crisis were to intensify.
For more background on the VVIX, check out this installment of Market Meaasures on the tastylive financial network. To follow everything happening in the markets, check out tastylive, weekdays from 7 a.m. to 4 p.m. CDT.
Sage Anderson is a pseudonym. He’s an experienced trader of equity derivatives and has managed volatility-based portfolios as a former prop trading firm employee. He’s not an employee of Luckbox, tastylive or any affiliated companies. Readers can direct questions about this blog or other trading-related subjects, to support@luckboxmagazine.com.