Trading the VIX of Crude Oil (OVX) and 15 Oils Stocks Amid War in the Middle East
Price volatility in the oil sector was already on the rise in early October, but the recent flare-up of hostilities in the Middle East has triggered another leg up in the “fear index” for crude oil

- The Crude Oil Volatility Index (OVX) spiked in the wake of the October 8 attacks against Israel.
- The OVX is now up roughly 18% over the last 5 days.
- Due to the mean reverting nature of implied volatility, sharp rallies in the OVX can present fresh opportunities to sell options in the energy sector.
With the Russo-Ukrainian war still raging in Eastern Europe, tragedy struck another corner of the world on Oct. 7, when terrorists in the Gaza Strip orchestrated a heinous surprise attack against Israel.
While the geopolitical ramifications of this event are tectonic in nature, one of the most immediate concerns for global investors and traders relates to the stability of the global energy markets.
Neither Israel nor the Gaza Strip is a significant exporter of crude oil, but the broader Middle East region is a critical supplier of global energy resources. To wit, estimates indicate that the Middle East holds as much as 48% of the world’s proven crude oil reserves.
In that regard, the recent flare-up between Israel and Palestine represents a threat to global energy markets because it could domino, and potentially trigger additional violence in other parts of the region.
Currently, one of the biggest concerns is that Iran will get involved in the hostilities, which could potentially ensnare other countries in the Middle East.
At this juncture, many experts have suggested that Iran assisted the terrorist organization Hamas in planning and preparing for the recent attacks against Israel. Whether that’s true or not, hostilities could quickly escalate between these two long-time enemies.
Obviously, the gravest concern right now is further loss of life, especially innocent civilians. Beyond that, Iran could attempt to derail the global economy by blocking/disrupting traffic in the Strait of Hormuz. The Strait of Hormuz is a key, strategic waterway because it lies amidst the only path between the Persian Gulf and the open sea.
Estimates indicate that somewhere around 33% of the world’s liquified natural gas passes through this strategic waterway, along with roughly 25% of the world’s total annual oil consumption.
Unfortunately, global energy markets are especially fragile at this moment due to disruptions linked to the ongoing war between Russia and Ukraine. That means any further supply shocks could be especially chaotic, and would almost assuredly inject a fresh bout of volatility into the prices of crude oil, natural gas and other key commodities.
The risk of further market disruptions likely helps explain why the CBOE Crude Oil Volatility Index (OVX) has jumped by roughly 18% over the last five days, and by more than 60% over the last month.
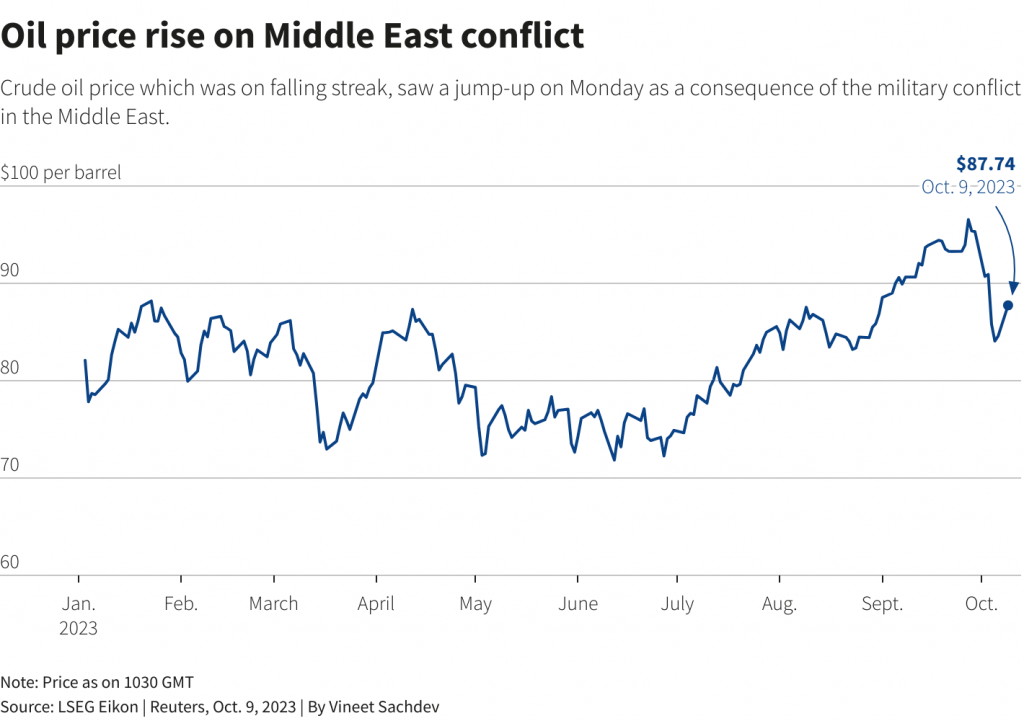
Crude oil has been one of the biggest movers in the market during 2023, climbing from $70/barrel to $95/barrel (+35%) between July 1 and September 30. Oil prices then corrected in early October, dropping as low as $82/barrel.
In the wake of the Hamas attacks on Israel, however, oil prices surged back above $85/barrel, and are now trading at roughly $86/barrel.
On Oct. 9—the first business day after the weekend surprise attacks against Israel—most of the energy sector was moving higher in sympathy with crude oil prices. And many energy stocks moved closely in line with crude.
Oil Sector Moves Higher on Middle East Chaos
On Monday, oil prices rallied by about 5%. The list below highlights the energy stocks making the biggest moves in the immediate aftermath of the recent Hamas attacks on Israel:
- Callon Petroleum Company (CPE), +9%
- Comstock Resources (CRK), +7%
- Matador Resources (MTDR), +7%
- Antero Resources (AR), +7%
- Marathon Oil (MRO), +7%
- Ovintiv (OVV), +6%
- Permian Resources (PR), +6%
- Murphy Oil (MUR), +6%
- Kosmos Energy (KOS), +6%
- SM Energy (SM), +6%
- ConocoPhillips (COP), +6%
- Devon Energy (DVN), +5%
- EOG Resources (EOG), +5%
- Crescent Energy (CRGY), +5%
- Consol Energy (CEIX), +5%
- Hess Corp (HES), +5%
- Coterra Energy (CTRA), +5%
- Range Resources (RRC), +5%
- Peabody Energy (BTU), +5%
- Occidental Petroleum (OXY), +5%
Some of the above symbols also appear on the list of stocks exhibiting the highest positive correlation with oil prices over the last 30 days. Listed below are the 15 stocks sharing the highest correlation with United States Oil ETF (USO) over the last month, and their associated correlation coefficients.
- Devon Energy (DVN), 0.76
- Diamondback Energy (FANG), 0.75
- Energy Select Sector SPDR Fund (XLE), 0.75
- BP Plc (BP), 0.74
- Marathon Oil (MRO), 0.73
- Hess Corp (HES), 0.73
- Occidental Petroleum (OXY), 0.73
- Oil & Gas Exploration & Production ETF (XOP), 0.73
- ConocoPhillips (COP), 0.73
- EOG Resources (EOG), 0.72
- APA Corp (APA), 0.71
- Exxon Mobil (XOM), 0.71
- VanEck Oil Services ETF (OIH), 0.70
- Halliburton Company (HAL), 0.68
- Chevron Corp (CVX), 0.59
As a reminder, when two underlyings are positively correlated—meaning they often move in the same direction—the correlation will range between somewhere 0 and 1. When two securities are negatively correlated—meaning they move in opposite directions—the correlation will range between -1 and 0.
Correlations are typically characterized as non-existent, weak, semi-strong, or strong—depending on the degree to which a given two underlyings are linked.
For example, 0.15 might be considered a “weak positive correlation,” whereas 0.75 might be considered a “strong positive correlation.” On the other hand, -0.20 might be considered “weak negative correlation,” while -0.80 might be referred to as a “strong negative correlation.”
As such, the oil stocks highlighted above (with correlation coefficients above 0.70) all share a relatively strong correlation with oil prices (or more specifically, with USO). It should be noted that the oil-focused volatility gauge OVX is likewise linked to options activity in USO.
Tracking Volatility in the Oil Patch
Aside from trading crude oil using price direction (i.e. long and short), investors and traders in the energy space can also trade crude oil using volatility.
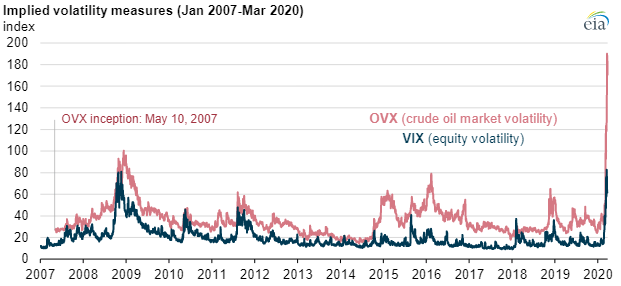
The CBOE Crude Oil Volatility Index (OVX) tracks volatility in the crude oil market much like the CBOE Volatility Index (VIX) tracks volatility in the S&P 500.
The OVX provides an up-to-date estimate of expected 30-day volatility in the crude oil market using options from the United States Oil Fund (USO). Interpreting the OVX is relatively easy, because the mechanics are very similar to the VIX.
For example, if crude oil is trading $100/barrel, a reading of 20 in the OVX would suggest that in the next 12 months, crude oil prices would be expected to settle somewhere between $80 and $120 (20% of $100 = $20), with a 68% degree of confidence.
Furthermore, this example would suggest that crude oil would be expected to finish the next 12 months trading between $60 and $140 with a 95% degree of confidence, or between $40 and $160 with a 99.7% degree of confidence.
Currently, the OVX is trading about 40, and has ranged between roughly 23 and 60 during the last 52 weeks. Over the last five days, the OVX has risen by roughly 18%, climbing from 33 to nearly 40.
Over the last 30 days, the OVX is up a jaw-dropping 60% because oil prices corrected sharply in early October, contributing to inflated volatility ahead of the October 8 attacks against Israel.
The all-time high in the OVX was observed during March of 2020, when the metric skyrocketed to 190 during the onset of the COVID-19 pandemic, as illustrated below.
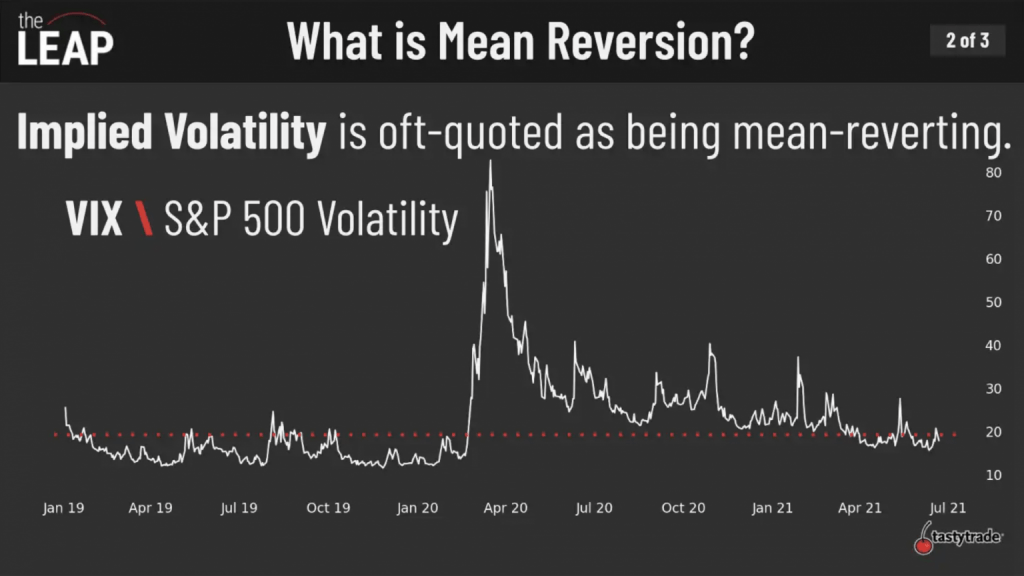
Trading Oil-Related Volatility Using Mean Reversion
As most market participants are well aware, volatility in the financial markets has proven over time to be mean-reverting.
In the trading world, mean reversion refers to the tendency of financial instruments to move toward their average price over time. Historical data has demonstrated beyond any reasonable doubt that volatility tends to move toward its average over time.
Investors and traders often buy/sell volatility when they view it as too cheap or too expensive.
Looking at an example, imagine that the 30-day historical volatility of stock XYZ is 20, and implied volatility (market volatility) for options with a one-year duration is priced at 30. In this case, an opportunity theoretically exists to sell options in stock XYZ with the expectation that actual volatility will be less than what the market is pricing.
If an investor/trader sells 30% volatility, and the underlying XYZ moves on a 20% volatility (as it had historically), then that position theoretically produces a profit.
While most investors and traders track the VIX to monitor potential options/volatility opportunities, the OVX is likewise valuable when considering a volatility-focused opportunity in the oil sector.
At present, the OVX is still trading well below its long-term median, which is closer to 68. However, considering that the OVX has traded between 24 and 60 over the last 52 weeks, the current reading of 39-40 is fairly close to the OVX’s recent midpoint range.
Going forward, investors and traders may want to add the OVX to their watchlists in order to track and trade potential opportunities in the crude oil sector that may stem from ongoing developments in Eastern Europe and the Middle East.
To identify specific opportunities, market participants can refer to metrics like Implied Volatility Rank (IV Rank). IV Rank reports whether implied volatility is high or low in a specific underlying based on the past year of implied volatility data.
For example, if hypothetical stock XYZ saw implied volatility range between 30 and 60 over the past year and implied volatility is currently at 45, XYZ would have an IV Rank of 50%. If implied volatility is currently trading 60 in XYZ, then IV Rank would be 100%.
Volatility traders often look to sell options/volatility when IV Rank is above 50%—although the threshold will vary depending on one’s specific outlook and risk profile.
Options sales in the oil patch could get more attractive if the OVX climbs even higher—for example, by surpassing its 52-week high of 60, or even rising above its long-term median of 68.
To follow everything moving the markets in 2023, including the options markets, tune into tastylive—weekdays from 7 a.m. to 4 p.m. CDT.
Andrew Prochnow has more than 15 years of experience trading the global financial markets, including 10 years as a professional options trader. Andrew is a frequent contributor Luckbox Magazine.
For daily financial market news and commentary, visit the News & Insights page at tastylive or the YouTube channels tastylive (for options traders), and tastyliveTrending for stocks, futures, forex & macro.
Trade with a better broker, open a tastytrade account today. tastylive, Inc. and tastytrade, Inc. are separate but affiliated companies.
Hungry for more? The next issue of Luckbox is food-focused looking at new growth opportunities and trading ideas in food, beverage, agricultural, hospitality and grocery stocks. Not a subscriber? Subscribe for free at getluckbox.com.
Note: The aforementioned OVX data was provided courtesy of Dr. Michael Rechenthin (aka “Dr. Data”) at tastylive.