Toyota vs. Tariffs: Why the Current Valuation Could Trump Trade Uncertainty
Toyota vs. Tariffs: Why the Current Valuation Could Trump Trade Uncertainty

- Toyota’s stock has dropped more than 25% over the past 52 weeks, but its strong market position and focus on hybrid and electric vehicles may bring long-term growth.
- The company’s recent investment in solid-state batteries, hybrid technology and electric vehicle production demonstrate its commitment to staying competitive.
- After the sell-off, Toyota’s low valuation and potential for growth make it a compelling option for investors looking for long-term upside.
These days, it’s easy to overlook the traditional giants of the automotive industry. While companies like Tesla (TSLA) and BYD (BYDDY) grab headlines, Toyota (TM), the world’s largest automaker by production, has quietly remained a key player in shaping the future of mobility. Despite challenges like a dip in stock price and market pressures, Toyota’s long-term strategy—focusing on hybrid vehicles, electric cars and innovations like solid-state batteries—still holds immense potential.
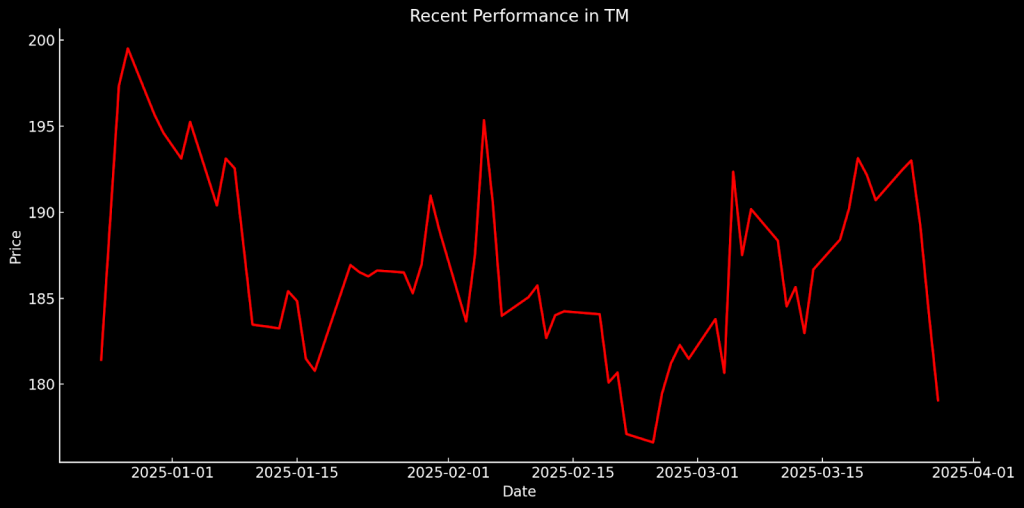
With Toyota’s shares down more than 25% over the last 52 weeks, a question arises. Is now the time to buy, or is there still more risk ahead? In this analysis, we’ll examine Toyota’s most recent earnings, assess its current valuation and consider how the company is positioning itself for growth amid challenges.

Toyota’s hybrid focus pays dividends
Toyota, one of the most influential players in the global automotive industry, has headquartered in Toyota City, Japan. The company produced 10.8 million vehicles in 2024, making it the world’s largest automaker by production volume. Its extensive portfolio ranges from fuel-efficient hybrids to luxury vehicles sold under its Lexus brand. The company has been an innovator in hybrid technology but is just beginning to catch up after a slow start in fully battery-electric (BEV) vehicles.
About 43% of the vehicles Toyota sold in 2024 featured some form of electrification, primarily hybrids. The company is also investing heavily in solid-state battery technology and hydrogen fuel cells, anticipating long-term benefits from these categories. Moreover, its focus on sustainability and technology is not limited to vehicles; the company has also been expanding into autonomous driving and humanoid robots, which highlights its vision of a future beyond just cars.
The automaker has faced challenges in recent quarters, including a dip in operating profits, stiffening competition and the need for continued investment in new growth areas. Shares of Toyota have reflected those challenges. Shares are down approximately 8% year-to-date and have dropped more than 25% over the past 52 weeks. And the Trump administration’s latest tariff announcement is another concern for the Japanese manufacturer.
Starting April 3, a 25% tariff will be imposed on cars and light trucks imported into the U.S., potentially complicating Toyota’s operations. While Toyota’s substantial presence in North America—including production of popular models like the Tacoma—offers some cushion, the uncertainty of shifting U.S. trade policies could weigh on investor sentiment. Toyota manufactures Tacoma trucks at two plants in Mexico, and in 2023, it sold approximately 230,000 units in the U.S.

Q4 earnings disappoint, but outlook remains strong
Toyota’s latest earnings report revealed mixed results, with the company posting a nearly 28% year-on-year decline in operating profit for the last quarter of 2024. Operating profit came in at $8.2 billion, falling short of analysts’ expectations of $9.4 billion. This dip in profitability was largely attributed to a combination of lower vehicle sales and production disruptions, which negatively affected critical markets such as Japan and China. Despite these challenges, Toyota’s net income attributable to the company surged to $14.7 billion for the full year, reflecting a substantial increase compared to $10.2 billion in the full year of 2023.
In terms of revenue, Toyota generated roughly $83 billion for the quarter, a 20% increase compared to the same period in 2023. The company’s consolidated vehicle sales reached 2.44 million units, a slight decline from 2.55 million units in the same quarter of 2023. Despite this drop in sales, Toyota’s revenue was boosted by increased demand for its hybrid vehicles, particularly in the United States, where hybrid sales accounted for nearly half of all vehicles sold. Toyota has increasingly relied on its strong hybrid models to drive growth, even as its competitors, like Tesla and BYD, push forward in the EV market.
On the positive side, Toyota has raised its full-year operating profit forecast to $31 billion, up from $28 billion. That signals confidence in its ability to adapt and grow in a dynamic market. The company is also ramping up its investment in electric EVs by establishing a subsidiary in Shanghai, China, aimed at producing Lexus-branded vehicles starting in 2027. The company is also strengthening its position in the electric vehicle market with the development of a $14 billion battery plant in North Carolina that will boost its capacity to meet growing demand for electrified vehicles.
However, the company’s stock remains under pressure, primarily because of broader global challenges. They include intensifying competition from Chinese automakers that are rapidly gaining market share. Another is the uncertainty surrounding the Trump administration’s new tariffs on automobile imports. While these factors may pose near-term risks, Toyota has consistently demonstrated resilience in the face of external pressures. Its proven track record of adapting to changing market conditions, coupled with its savvy long-term vision, supports a cautiously optimistic outlook moving forward.
Undervalued, but tariff uncertainty clouds outlook
While Toyota’s recent stock performance has been underwhelming, the current valuation presents a potentially attractive entry point for investors. The stock is trading at a GAAP TTM P/E ratio of 8, significantly below the sector median of 18. This discounted valuation suggests the market may be underestimating Toyota’s profitability, particularly when considering its dominant position in the global automotive market and its strong long-term growth potential, especially in the EVs and hybrids.
Toyota’s price-to-sales ratio of 0.90 aligns with the sector median, reflecting a fair valuation based on its revenue generation. This indicates Toyota is not overvalued in terms of sales. But with the company’s expanding presence in the electric vehicle market and its continued dominance in hybrids, the stock is positioned to benefit from growth in revenue, particularly if it successfully ramps up its EV production and adapts to shifting market dynamics, including tariff-related pressures.
The price-to-book (P/B) ratio for Toyota stands at 1.10, well below the sector median of 2.0. This suggests the stock is trading at a discount to its book value, which can be particularly appealing for value investors. For an auto manufacturer like Toyota, this could present an attractive entry point for those looking to leverage the company’s strong asset base, particularly as it invests in innovative technology, such as solid-state batteries and advanced hybrid vehicles.
Analyst sentiment remains convincingly positive, with 16 of the 23 analysts covering the stock rating the shares a “buy” or “overweight.” The average price target for Toyota’s stock is $220 per share, reflecting considerable upside potential from its current price of $180. Overall, this data shows analysts maintain optimism about Toyota’s long-term growth despite near-term challenges.
Takeaways
In terms of valuation, Toyota’s stock is undeniably appealing. Trading at a GAAP TTM P/E ratio of 8, well below the sector median of 18, the stock seems undervalued relative to its solid profitability and market leadership. Additionally, with a price-to-book ratio of 1.10, compared to the sector’s 2.0, the company appears to be trading at a discount to its intrinsic value, which could be enticing for long-term investors looking for value. As it continues to innovate and invest in critical areas like solid-state batteries and hybrid technology, these metrics suggest potential upside as the company capitalizes on new growth opportunities.
However, the cloud of uncertainty hovering over Toyota can’t be ignored. With U.S. tariffs and mounting competition from aggressive Chinese automakers, the company faces headwinds that could affect its operations and stock performance in the near term. While Toyota’s history of resilience and its strategic investment in EVs and hybrid models provide optimism, the risk posed by shifting trade policies complicates its outlook. The stock’s current valuation presents an intriguing entry point, but risk-averse investors may prefer to wait and see how the new U.S. trade policies affect the industry before committing to new exposure.
Andrew Prochnow, Luckbox analyst-at-large, has more than 15 years of experience trading the global financial markets, including 10 years as a professional options trader.
For live daily programming, market news and commentary, visit tastylive or the YouTube channels tastylive (for options traders), and tastyliveTrending for stocks, futures, forex & macro.
Trade with a better broker, open a tastytrade account today. tastylive, Inc. and tastytrade, Inc. are separate but affiliated companies.