Trading the Fastest Crash/Rebound in History

The 2020 trading year is far from over, but if the first five months were any indicator, investors and traders may want to buckle up because 2020 could conclude as one of the “fastest” markets in history.
The trading year began with U.S. market indexes notching all-time highs in February, on the heels of a freshly signed Phase I trade deal between the United States and China.
The euphoria, however, was short-lived, as the coronavirus pandemic served up maybe the starkest reality check so far in this young century.
Aside from dishing up a large dose of economic uncertainty, much like the Dot-com Bubble and the Great Recession, the coronavirus was claiming tens of thousands of lives and spreading to every corner of the planet.
All-time highs devolved with record speed into a bear market correction, all in the span of 19 trading days—the shortest time frame in history from all-time highs to bear-market lows.
Then came the rebound.
From March 23 to present, U.S. market indexes, despite substantial economic and societal headwinds, are once again pushing near all-time highs. And in terms of speed, the S&P 500 gained 38% during a recent 50-day window, the largest such increase in history.
The price chart below highlights how the major U.S. stock indexes have performed through the first five months of 2020:
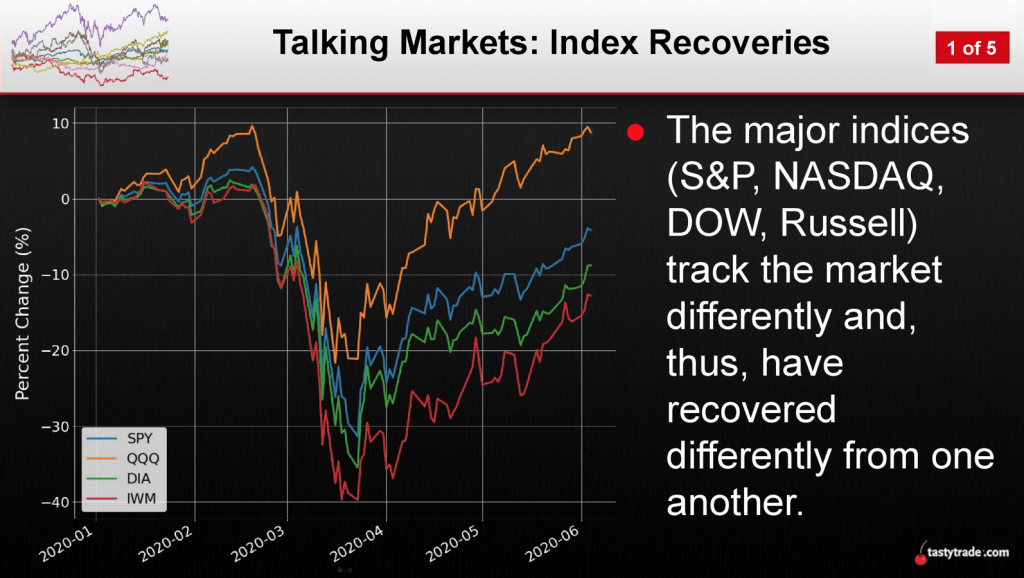
One can see in the above chart that the Nasdaq (QQQ) has climbed the highest of the four indexes during the rebound, but then again, the Nasdaq was also the one that dropped the least during the correction.
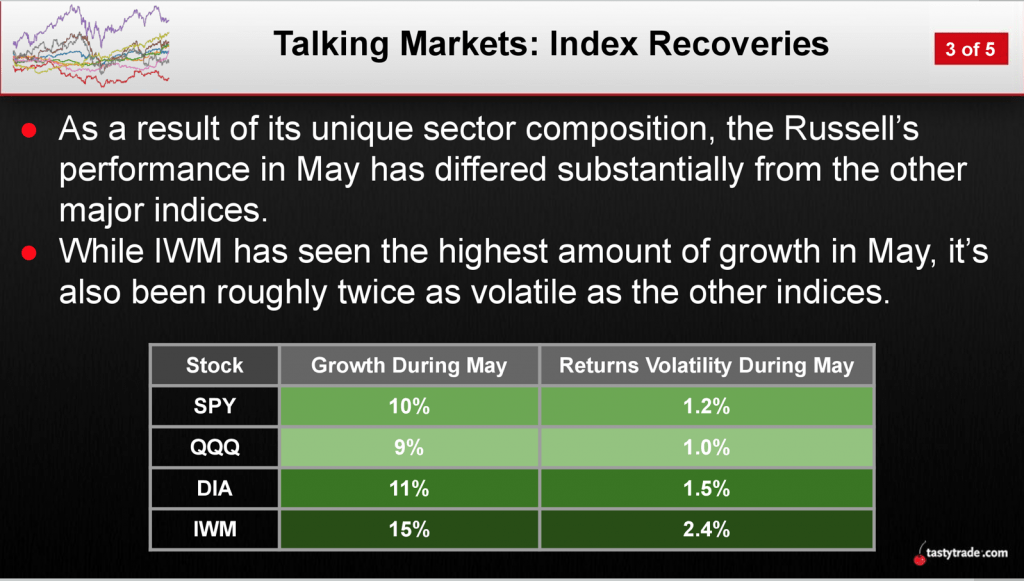
The small-cap orientated Russell 2000 (IWM), on the other hand, has rallied the hardest of the four indexes in May/June, likely because it was a severe laggard earlier in the year.
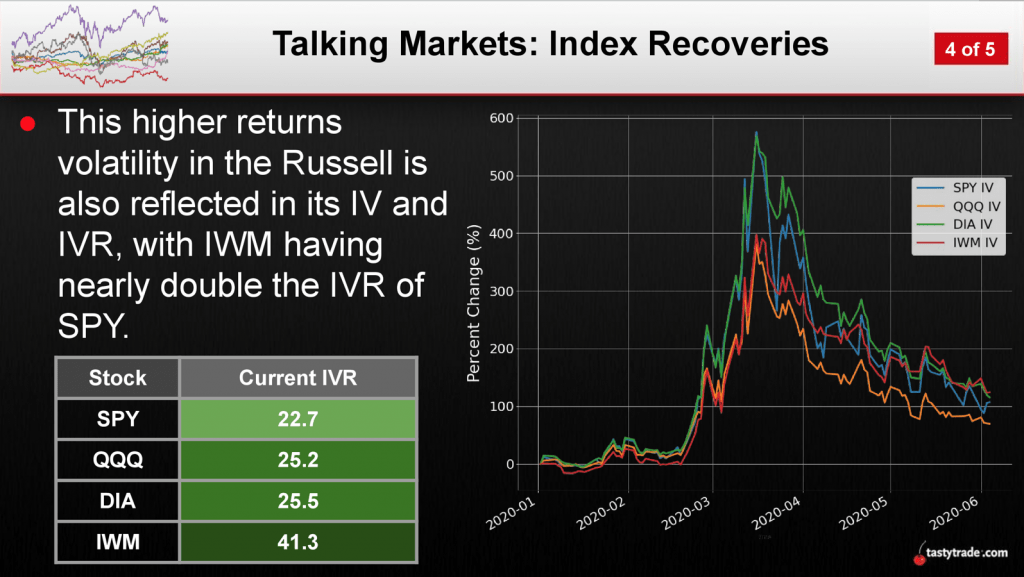
The IWM has also been the most volatile of the four major market indexes of late, which is reflected in sustained levels of heightened implied volatility, as illustrated in the graphics below:
In sum, the roundtrip observed in 2020 from all-time highs to a bear market correction and back to all-time highs has been the fastest in history.
It’s certain that at least a part of that is due to emergency assistance provided by the U.S. government and Federal Reserve (read: “QE infinity”). But many other elements of this particular equation aren’t yet fully understood, especially with more than six months left in the trading year and unemployment still hovering at the highest levels observed since the Great Depression.
As one might expect, given the strong historical inverse correlation between the VIX and SPY, overall market volatility has also declined rapidly in the last couple months of trading, as shown below:
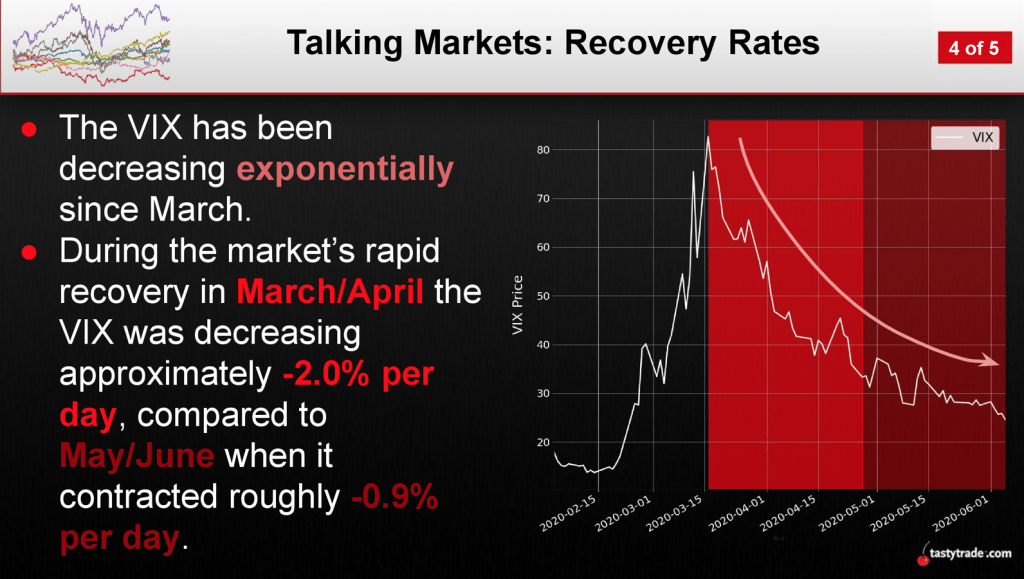
In absolute terms, the VIX is now down roughly 70% since reaching its all-time high of 82.69 on March 16.
And while the speed of the market has certainly been incredible, market participants need to keep in mind that the current rally hasn’t necessarily been as robust as the headline numbers suggest.
For example, 73% of the stocks included in the Wilshire 5000 index still have negative returns year-to-date. Doubters may want to look at symbols such as Hertz (HTZ) and Whiting Petroleum (WLL).
Digging deeper into the data, it appears that being a large capitalized technology company has been of real assistance in the current trading year.
The FANG+ Index (NYFANG), which includes the likes of Facebook (FB), Apple (AAPL), Amazon (AMZN), Google (GOOGL) and Netflix (NFLX), is up nearly 25% this year. Meanwhile, the more balanced SPY and small-cap orientated IWM are both down about 5%.
With over six months of trading yet to go in 2020 and a presidential election tucked inside that timeframe, there’s no telling how this particular ride might end.
To learn more about how the recent crash in stocks—and associated rebound—compares to other market crises in the 21st century, readers may want to review a recent episode of Tasty Extras on the tastytrade financial network when scheduling allows.
To monitor all the daily action in the markets, readers can also tune into TASTYTRADE LIVE weekdays from 7:00 a.m. to 3:00 p.m. Central Time, at their convenience.
Sage Anderson is a pseudonym. The contributor has an extensive background in trading equity derivatives and managing volatility-based portfolios as a former prop trading firm employee. The contributor is not an employee of luckbox, tastytrade or any affiliated companies. Readers can direct questions about any of the topics covered in this blog post, or any other trading-related subject, to support@luckboxmagazine.com.